Fig. 3.
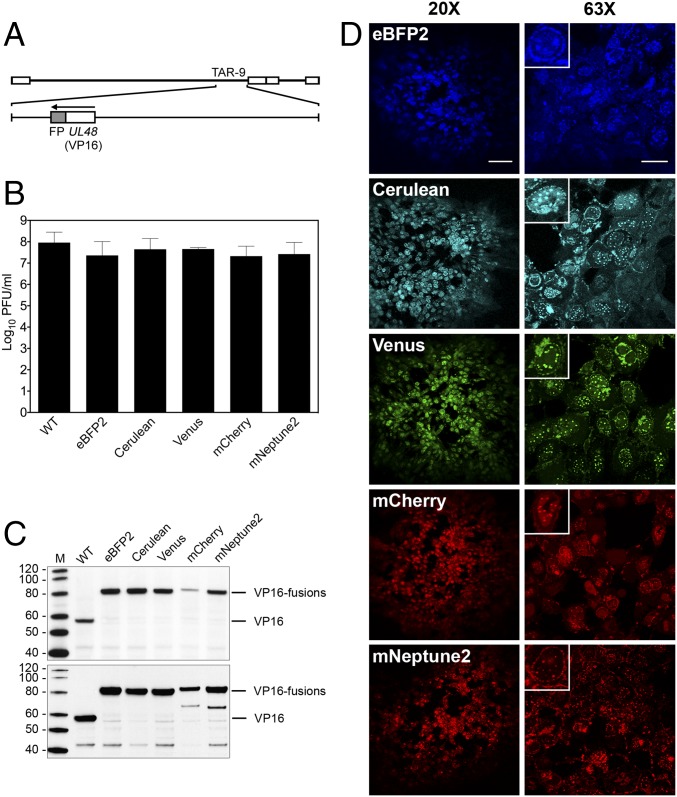
Analysis of recombinant KOSYA genomes expressing five different VP16 FP fusions. (A) A linear map of the KOS genome shows TAR-9, which was modified to contain five different FP fusions (shaded gray) to the C terminus of VP16, which is encoded by UL48. (B) Single-step growth curve analysis was performed for each VP16FP fusion virus and compared with KOSYA (WT). Vero cells were infected at a MOI of 10 PFU per cell and harvested 24 hpi. The titer of virus produced from infected cells after a single cycle of growth was enumerated by plaque assay and the results plotted on the graph. Data are an average of two independent infections. Error bars represent 1 SD. (C) Western blot analysis of proteins from infected cell lysates. Cells were harvested at 8 hpi (Upper) and 24 hpi (Lower) and the infected cell proteins were probed with anti-VP16 antibodies (LP1) following transfer to membranes. Protein standards are in lane M and are labeled in kilodaltons. (D) Confocal analysis was used to analyze KOSYA viruses expressing a range of FP fusions to VP16. Vero cell monolayers were infected at a low MOI and at 72-hpi images were taken with 20× and 63× objective lenses. [Scale bars, 100 µm (Left) and 25 µm (Right).] Insets show a single infected cell. Inset images were cropped from the 63× images to highlight a single infected cell and were each equally digitally enlarged for visibility.

