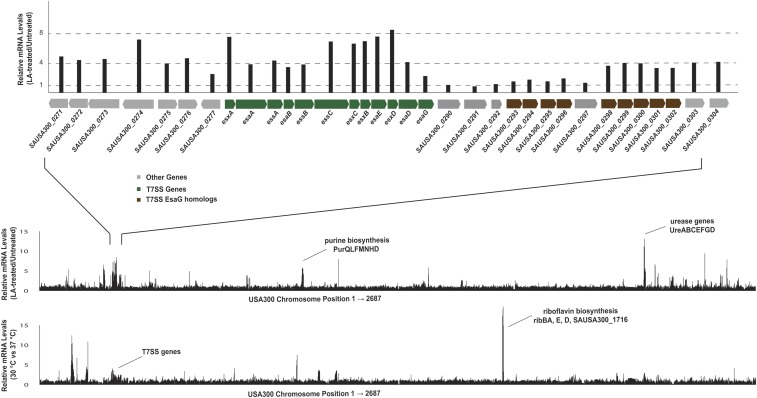
Fig. S4.
(Top) USA300 cells were grown in TSB alone or in TSB supplemented with 10 µM LA, and global transcript levels were measured by RNA-seq. (Middle) The fold-change (+LA/−LA) is plotted on the y axis, and the chromosomal position of each gene is plotted on the x axis. (Bottom) USA300 cells were grown in TSB at 37 °C or 30 °C, and global transcript levels were measured by RNA-seq. The fold change (30 °C/37 °C) is plotted on the y axis, and the chromosomal position of each gene is plotted on the x axis.

