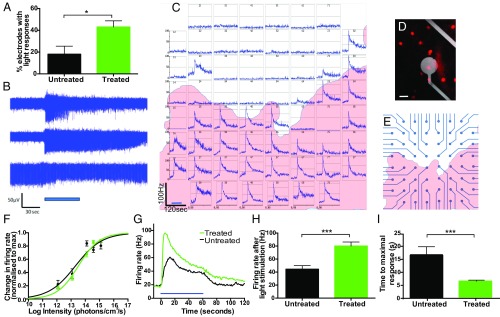
Fig. 2.
Human melanopsin expressed in the degenerate retina is able to mediate a functional response to a light stimulus. Multielectrode array (MEA) recordings from ex vivo rd1 mouse retinas showed a higher percentage of electrodes demonstrating light-induced increases in action potential firing in treated retinas compared with untreated controls (A) (P = 0.028, two-tailed unpaired t test; treated, n = 6; untreated, n = 9). Examples of raw data obtained from individual electrodes following 60-s 480-nm light pulses are shown (B). Light responses recorded from electrodes from one treated retina are shown (C) [represented as mean spike firing rate (in hertz) measured in 1-s bins; data shown are 30 s of baseline recording followed by a 60-s 480-nm light stimulus at 3.99 × 10¹⁴ photons⋅cm−2⋅s−1; for original image of the retina showing location of DsRed-positive cells, see Fig. S4]. Visualization of DsRed fluorescence (dots) illustrates the area of the retina transduced by the human OPN4 vector relative to the position of MEA recording electrodes (D). (Scale bar, 15 μm.) A representation of DsRed expression (highlighted in red) is shown to indicate the transduced areas of the treated retina in C relative to the positioning of electrodes (E). In combination, this illustrates an increase in light-dependent action potential firing within regions of transduced retina. IRCs generated from responsive electrodes in treated (n = 51 electrodes, n = 3 retinas) and untreated (n = 22 electrodes, n = 4 retinas) retinas show a similar sensitivity of responses between groups (F), with action potential firing detected at the lowest light intensity assessed (1.20 × 10¹² photons⋅cm−2⋅s−1). The mean response of all electrodes to a 3.99 × 10¹⁴ photons⋅cm−2⋅s−1 light stimulus is shown (G). Blue bars indicate duration of light stimuli (B, C, and G). There was a greater increase in spike firing rate in response to a light stimulus in treated versus untreated retinas (H); and time to maximal response was shorter in treated retinas compared with untreated controls (I) (***P < 0.001, two-tailed unpaired t test). For further description of response kinetics, see Fig. S4.

