Fig. S7.
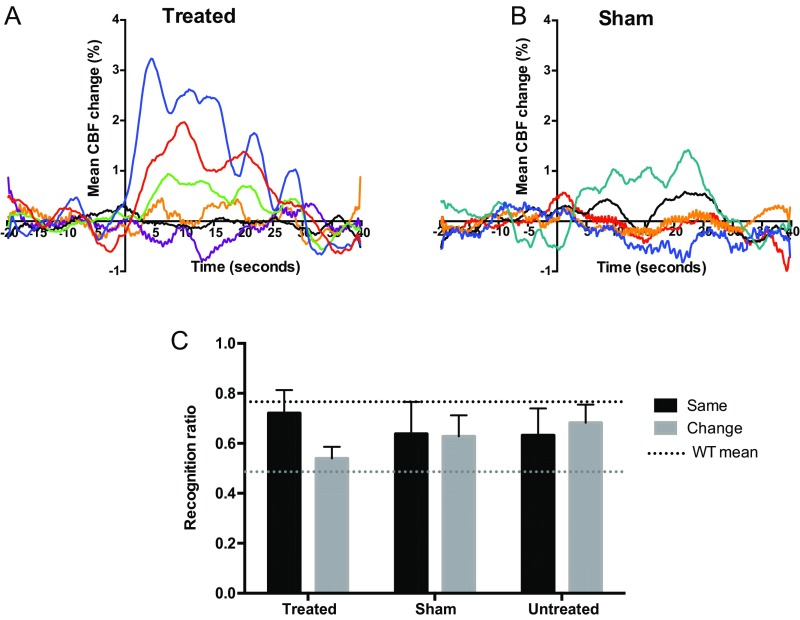
Melanopsin gene therapy leads to visual responses requiring image-forming vision. Blood flow changes in the visual cortex were measured for 20 s in darkness, and then a 2-s, 480-nm light stimulus was applied to both eyes of OPN4 vector-treated (n = 6) and sham-injected (n = 5) mice (light stimulus onset at 0 s). Examination of cortical blood flow responses detected using laser speckle cortical imaging from individual animals revealed three OPN4 vector-treated animals (A) with appropriate early peaks in blood flow following the light stimulus but no sham-injected control animals (B) showing characteristic responses. Visual context recognition testing was performed 2 mo after treatment (C). Recognition ratios for the novel object are shown when both sample and test phases were performed in the same visual environment (black bar) or when there was a change in environment (gray bar). There was a trend for treated mice to show visual context-dependent behavior (mean recognition ratio 0.72 ± 0.09 Same versus 0.54 ± 0.04 Context Change); however, when the younger cohort was analyzed alone, this did not reach statistical significance (two-way repeated-measures ANOVA with Bonferroni post hoc test). No such trend was seen in sham-injected or untreated mice: the level of performance was similar in the Same and Context Change conditions in these groups (sham-injected group mean recognition ratio 0.64 ± 0.13 Same versus 0.63 ± 0.08 Context Change; untreated group mean recognition ratio 0.63 ± 0.11 Same versus 0.68 ± 0.07 Context Change). Treated, n = 12; sham-injected, n = 10; untreated, n = 12; dashed line, wild-type mean. Post hoc power analyses revealed that the observed power of the visual restoration effect was lower in the younger cohort, suggesting that the likelihood of replicating the treatment effect is higher in older animals. However, when both younger and older cohorts were combined in a split-plot ANOVA, the effect of visual context on behavior in the treated group overall was highly significant (P = 0.003), with no significant interaction between treatment and age of the animals (P = 0.445) (Tables S1 and S2).

