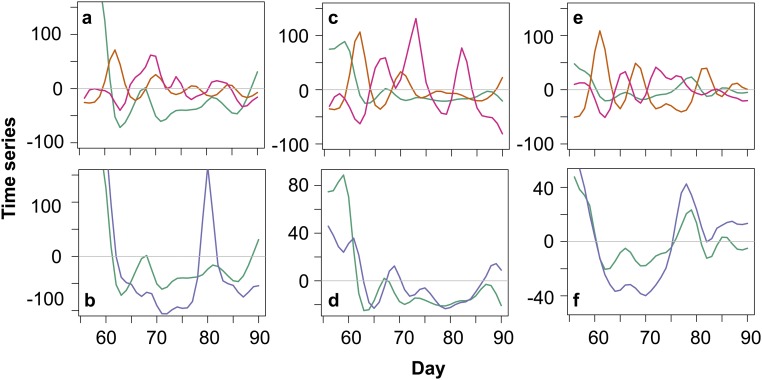
Fig. S8.
Detrended and smoothed time series data used for wavelet coherence analyses for complex system when algae, virus, and predator coexist (day > 57). Green, algae; orange, rotifers; blue, virus; pink, mean colony size. (A and B) Correspond to Fig. 1G; (C and D) correspond to Fig. 1H; (E and F) correspond to Fig. 1I. Time series from one replicate are split into two panels for representation purposes.

