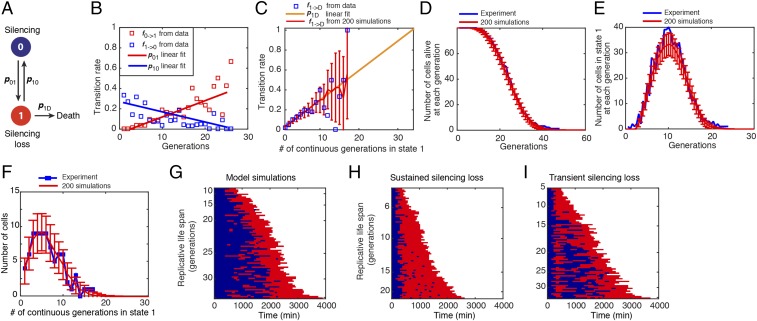
Fig. 4.
A phenomenological model of cell aging. (A) Schematic diagram of the model. The circles indicate the cellular states, and the arrows depict transitions between the states. (B) The statistics of silencing state transitions as a function of age. The fraction of all cells at state 0 of a given generation that switch to state 1 at the next cell cycle (red) and the fraction of the cells at state 1 that return to state 0 at the next cell cycle (blue) have been computed as a function of age. (C) The transition rates from state 1 to death as a function of the number of consecutive generations in state 1. Blue squares are experimentally measured fractions of cells that died exactly after N consecutive generation in state 1 over the total number of cells that lived for at least N generations. Yellow straight line is a linear fit of these data (0 < N < 10). The red line and the error bars indicate the mean and SD of the fraction from simulations. (D) The average number of cells alive as a function of age and the SD in simulations (red line and error bars) and experimental data (blue line). (E) The average number of cells in state 1 as a function of the age and the SD in simulations (red line and error bars) and experimental data (blue line). (F) The distribution of the number of consecutive generations in state 1 until death in simulations (red line and error bars) and experimental data (blue line). All simulation results in C–F were obtained from 200 stochastic simulations of 79 cells. (G) Single-cell state trajectories from a single stochastic simulation of the model with 79 cells at time 0. Each row represents the time trace of a single cell throughout its life span. Blue corresponds to state 0, and red to state 1. Cells are sorted based on their RLSs. (H) Single-cell state trajectories simulated using modified transition rates to reflect sustained silencing loss. (I) Single-cell state trajectories simulated using modified transition rates for four generations to reflect transient silencing loss. Details of the model are included in SI Appendix.

