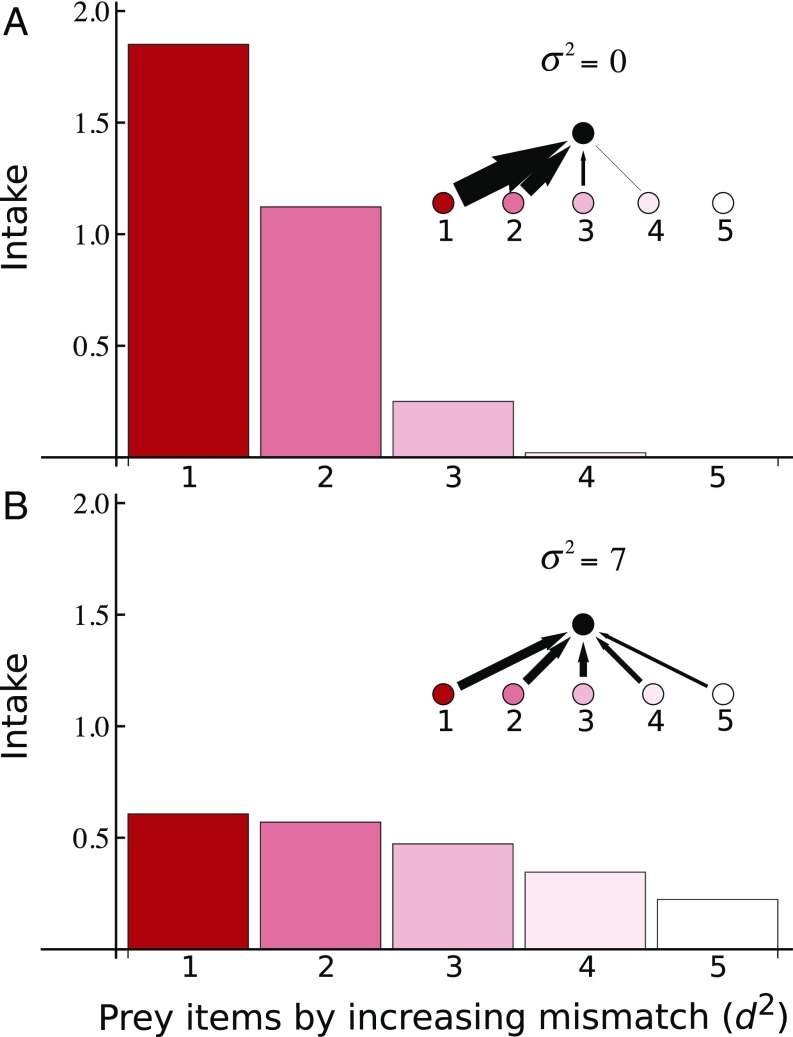
Fig. 1.
Intake rate for a predator with each of the species consumed or potentially consumed ordered by increasing phenotypic mismatch (d2 = 1 to d2 = 25) for increasing levels of phenotypic variation. (A) and (B) . We assumed interactions did not occur if foraging rates were smaller than 0.001 (e.g., Fig. 1A). For details on all other parameters, see SI Appendix, Appendix A.

