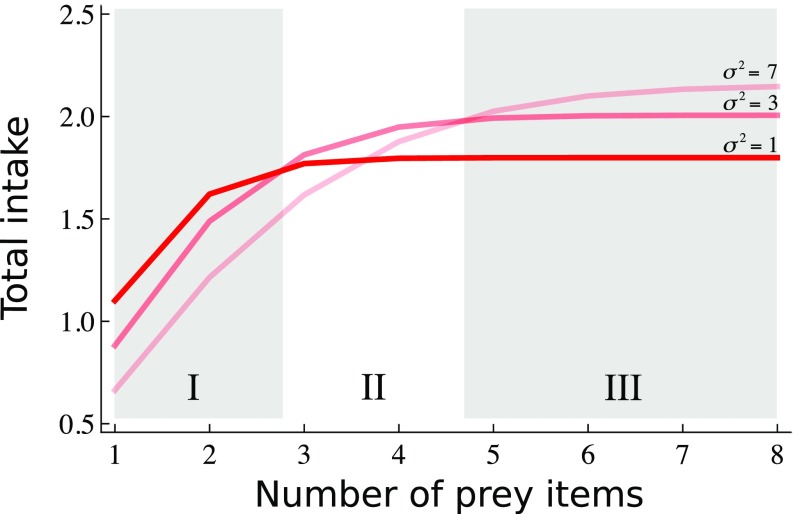
Fig. 2.
Total intake rate (sum of intake rates over all species consumed for a given predator) for three levels of phenotypic variation. Gray zones (I–III) represent the range of possible prey items at which low variation maximizes total intake (I), intermediate levels of variation maximize intake (II), or large levels of variation do (III) (details in SI Appendix, Appendix B).

