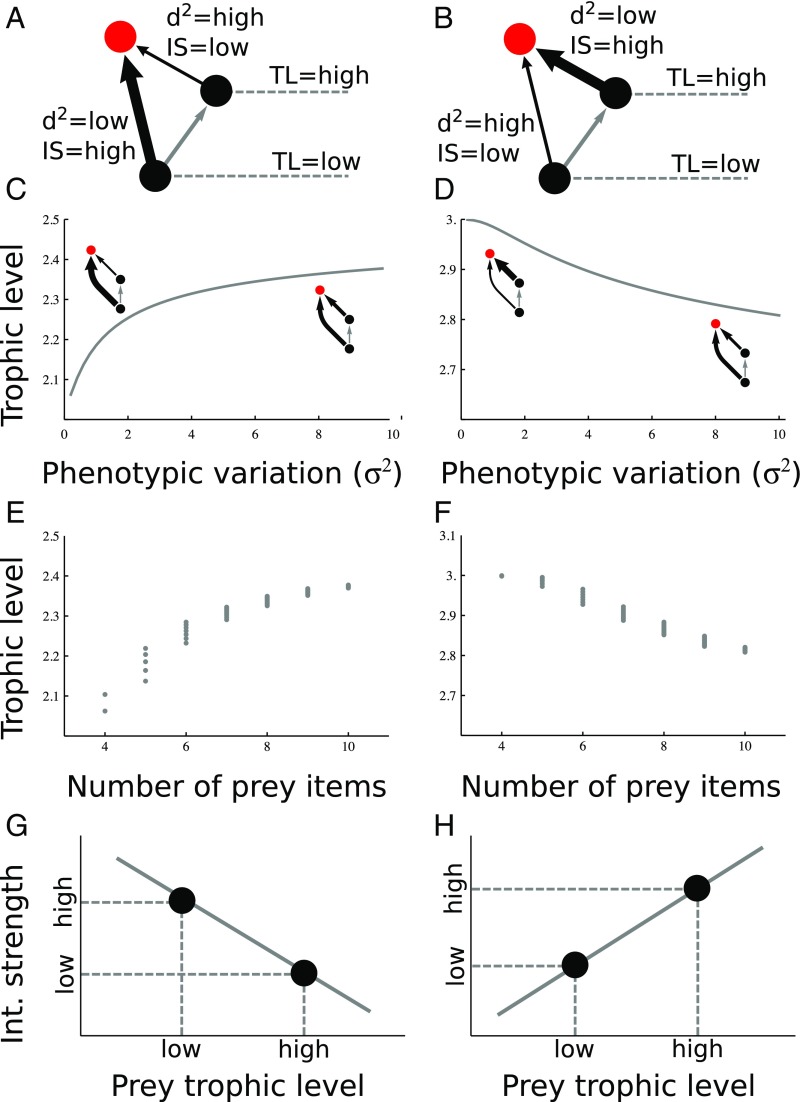
Fig. 3.
(Top row) Diagrams depicting the cases analyzed (case 1: A; case 2: B), with black balls representing prey, red balls representing the focal top predator, and arrows representing feeding interactions (thickness = strength). (Second row) How trophic level of the top species (red) changes with phenotypic variation whenever the predator relies more heavily on the bottom species (d2bottom = 0) than on the intermediate species (d2interm = 2) (C), and vice versa (D). (Third row) Predicted relationship between trophic level and predator connectivity for the first case (E), and the second case (F). (Bottom row) Predicted relationship between the trophic level of a prey item and the interaction strength of that particular interaction for the first case (G), and the second case (H). All parameters are as in the second row, and we used the same threshold for interactions as in Fig. 1.

