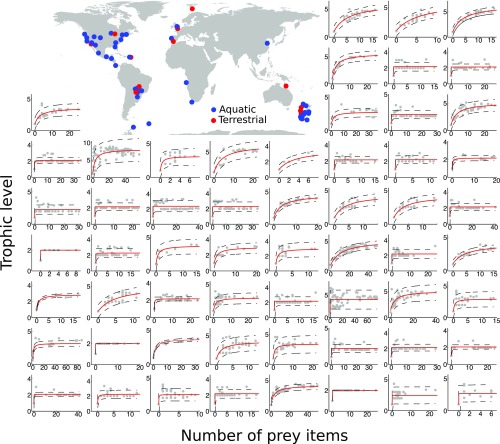
Fig. 4.
As predicted, the trophic level of species in 58 empirical food webs show a saturating increase with the number of prey items, although food webs vary in how fast that saturation occurs. Gray dots are the values for both quantities in each species of the food web. Red lines are best fit lines with 95% prediction lines in dashed black. Food web names in order of appearance in SI Appendix, Appendix E.

