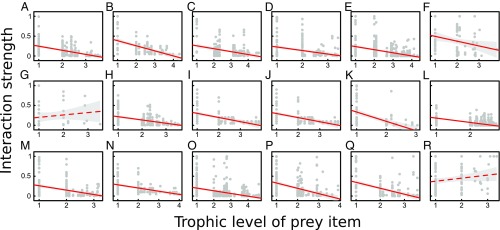
Fig. 5.
As predicted by theory, the trophic level of a given prey type is generally negatively related to the interaction strength with that prey across predators in the food web (gray dots). Red lines represent predictions of a linear regression with 95% confidence intervals (gray shaded regions). We observed that, in all but two cases (G and R), the relationship between the two variables is significantly negative (P < 0.001). (A) Alvarado, slope = −0.10 ± 0.01 SE; (B) Angola, slope = −0.13 ± 0.02 SE; (C) Braço Morto, slope = −0.07 ± 0.01 SE; (D) Cádiz, slope = −0.09 ± 0.02 SE; (E) Chesapeake, slope = −0.08 ± 0.12 SE; (F) Corrente, slope = −0.12 ± 0.05 SE; (G) Huizache, slope = +0.06 ± 0.07 SE, P = 0.376; (H) Itaipú (83–87), slope = −0.08 ± 0.01 SE; (I) Itaipú (88–92), slope = −0.10 ± 0.02 SE; (J) Mondego, slope = −0.10 ± 0.02 SE; (K) Northern California, slope = −0.23 ± 0.04 SE; (L) Onca, slope = −0.11 ± 0.01 SE; (M) Paraná, slope = −0.11 ± 0.02 SE; (N) Reef, slope = −0.08 ± 0.01 SE; (O) Scotia Sea, slope = −0.07 ± 0.01 SE; (P) St. Marks, slope = −0.13 ± 0.02 SE; (Q) St. Martin, slope = −0.15 ± 0.02 SE; (R) UK Grassland, slope = +0.08 ± 0.05 SE, P = 0.097.

