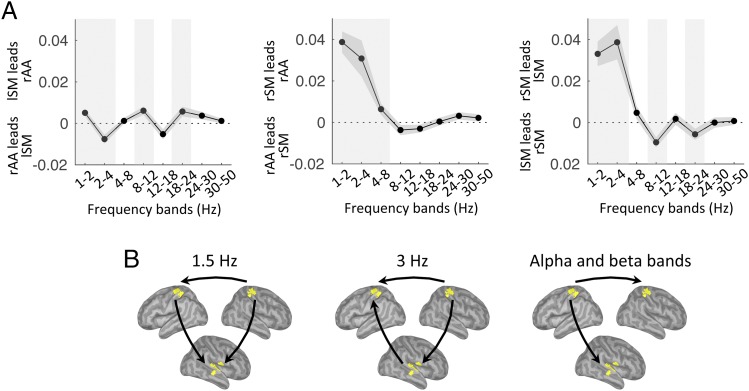
Fig. 6.
Tracking: Frequency-specific directional interactions between rAA, lSM, and rSM cortex. (A) Directed functional connectivity between rAA and lSM (Left), rAA and rSM (Center), and lSM and rSM (Right), in the range of 1–50 Hz for tracking correct trials. Shaded vertical bars highlight significant effects. (B) Schematic of the main significant results depicted in A (n = 19; paired t tests, P < 0.05, FDR-corrected).

