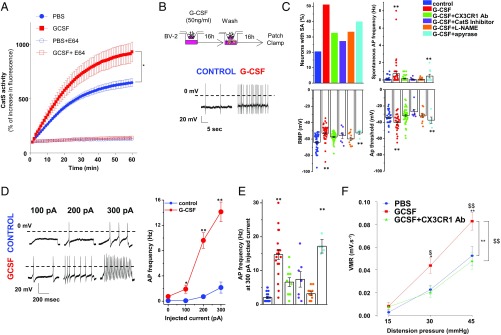
Fig. 3.
G-CSF–treated microglia increases excitability of DRG neurons through Cathepsin S-CX3CR1-iNOS signaling. (A) Mice were treated intrathecally with either PBS or G-CSF (20 ng) 12 h before evaluating Cathepsin S activity in thoracolumbar spinal cord lysate (n = 3 experiments). (B) Cartoon illustrating the coculture system experiment. BV2 microglia cells were plated into the upper chamber of a transwell and treated with G-CSF for 16 h. G-CSF was removed, and DRG neurons were plated in the lower chamber of the transwell for 16 h of coculture and then used for electrophysiological recordings. (Lower) A representative trace of spontaneous activity (SA) in a small-size TRPV1-sensitive DRG neuron cocultured with vehicle- or G-CSF–primed BV2 cells. (C) Exposure of BV2 microglia to G-CSF depolarizes the resting membrane potential (RMP) of DRG neurons and increases the percentage of neurons with SA (5/28 in control, 17/30 for G-CSF treated, 10/31 for G-CSF combined with CX3CR1 Ab-treated, 3/11 for G-CSF combined with Cat S inhibitor-treated, 5/15 for G-CSF combined with L-NAME, and 4/10 for G-CSF combined with Apyrase). (Right) G-CSF induces a decrease in the AP threshold and an increase in spontaneous AP discharge. These parameters are reversed by cotreatment with CX3CR1 Ab, Cathepsin S inhibitor, or L-NAME, but not apyrase. (D) Representative AP discharge evoked by 100-, 200-, and 300-pA current injections (1 s) in control (blue circle) and G-CSF (red circle) and for different conditions of treatment (E). (F) Measure of VMR to colorectal distension in mice injected with PBS (n = 9), G-CSF (20 ng; n = 12), or G-CSF + CX3CR1 Ab (5 µg; n = 9) 12 h before recording. Results indicate mean ± SEM (*P < 0.05; **P < 0.01). Statistical analysis was performed using one-way (C and E) or two-way ANOVA (A, D, and F) followed by Bonferroni post hoc test (*P < 0.05; **P < 0.01; $P < 0.05; $$P < 0.01).

