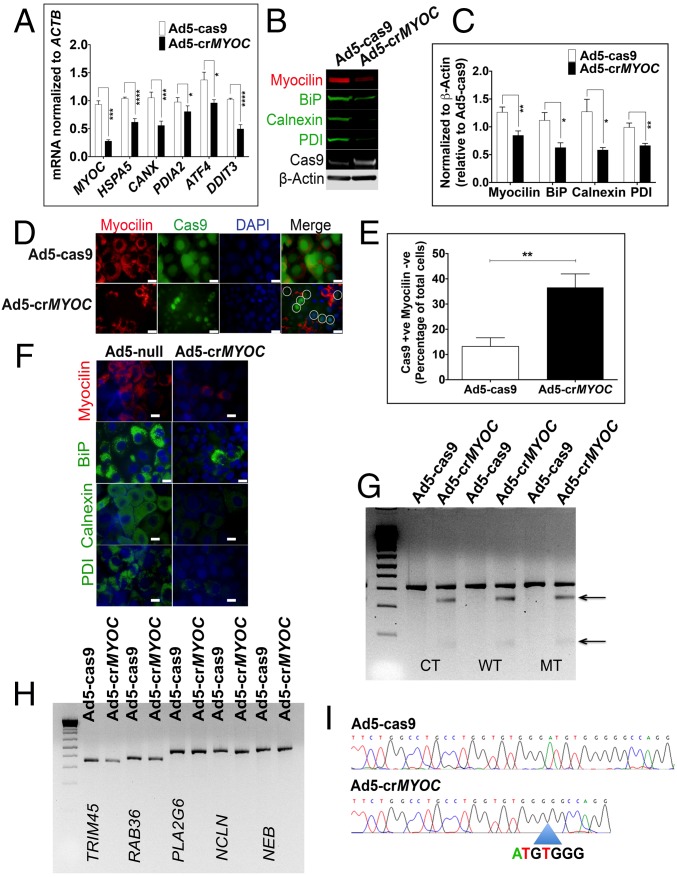
Fig. 1.
MYOC disruption by CRISPR-Cas9 in vitro. (A) Ad5-crMYOC treatment of stably transfected NTM5 cell lines overexpressing a mutant (MT) form of human MYOC decreases myocilin (MYOC), BiP (HSP5), Calnexin (CANX), PDI (PDIA2), ATF4 (ATF4), and CHOP (DDIT3) mRNA expression (n = 5). (B) Representative Western blot showing that Ad5-crMYOC decreases mutant myocilin and associated BiP, Calnexin, and PDI (n = 5). Cas9 and β-actin served as loading controls. (C) Densitometry showing significant decreases in myocilin, BiP, Calnexin, and PDI. (D) ICC showing that Ad5-crMYOC treatment decreases myocilin (n = 5). Most of the Cas9 (green)-positive cells are MYOC (red)-negative (denoted by circles in the last panel). (Scale bar: 20 µm.) (E) Quantification of Cas9-positive but myocilin-negative cells showing a significant increase in numbers after Ad5-crMYOC treatment. (F) Ad5-crMYOC–mediated decrease in myocilin (red) and associated BiP, Calnexin, and PDI levels (green; ICC). (Scale bar: 100 µm.) (G) GeneArt Genomic Cleavage assay showing cleavage bands from the MYOC PCR product (arrows) in Ad5-crMYOC–treated DNA in all three cell lines: control (CT), WT, and mutant (MT). (H) GeneArt genomic cleavage assay showing no cleavage bands from predicated off-target sites in PLA2G6, NCLN, and NEB, confirming gRNA specificity for the MYOC gene. (I) Clonal sequencing of the PCR product from Ad5-crMYOC treated samples revealing the most common 7-bp (ATGTGGG) deletion. The error bars represent SEM. *P < 0.05; **P < 0.01; ***P < 0.001; ****P < 0.0001, one-way ANOVA or paired Student’s t test.

