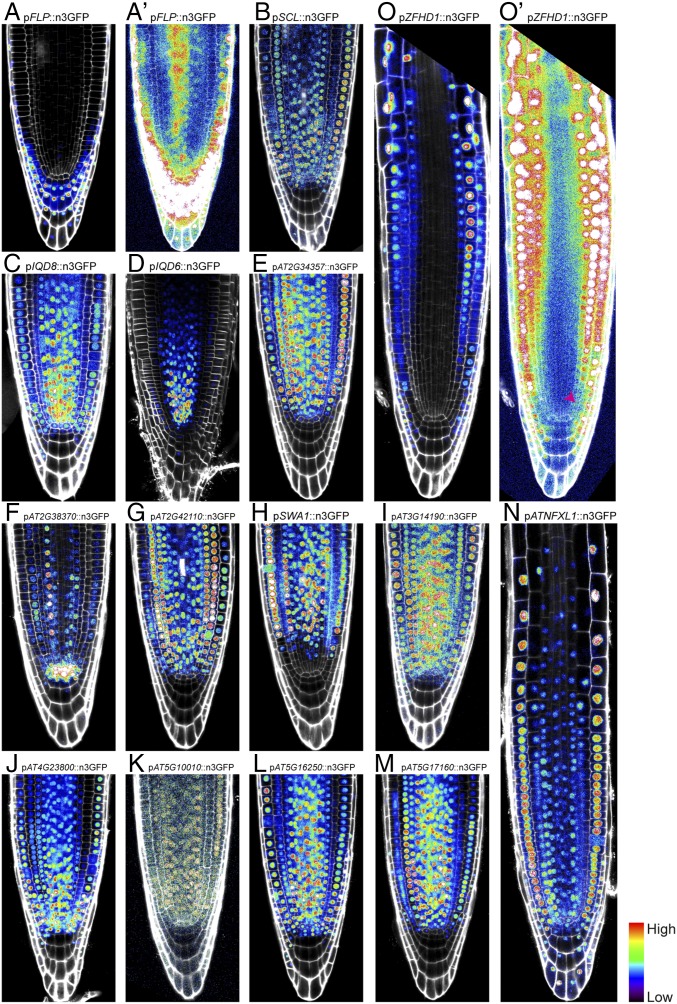
Fig. 3.
Overview of expression profile as visualized by promoter activity in confocal micrographs, of selected genes: all lines with visible expression in the root tip follow the RNA-sequencing-predicted graded expression profile. (A) 1: FLP; (A′) overexposed image of A; (B) 2: SCL; (C) 3: IQD8; (D) 4: IQD6; (E) 5: AT2G34357; (F) 7: AT2G38370; (G) 8: AT2G42110; (H) 9: SWA1; (I) 10: AT3G14190; (J) 11: AT4G23800; (K) 12: AT5G10010; (L) 13: AT5G16250; (M) 14: AT5G17160; (N) 16: ATNFXL1; (O) 17: ZFHD1; (O′) overexposed image of O shows very low signal in first meristematic cells (pink arrowhead). Micrographs were taken at the same magnification.

