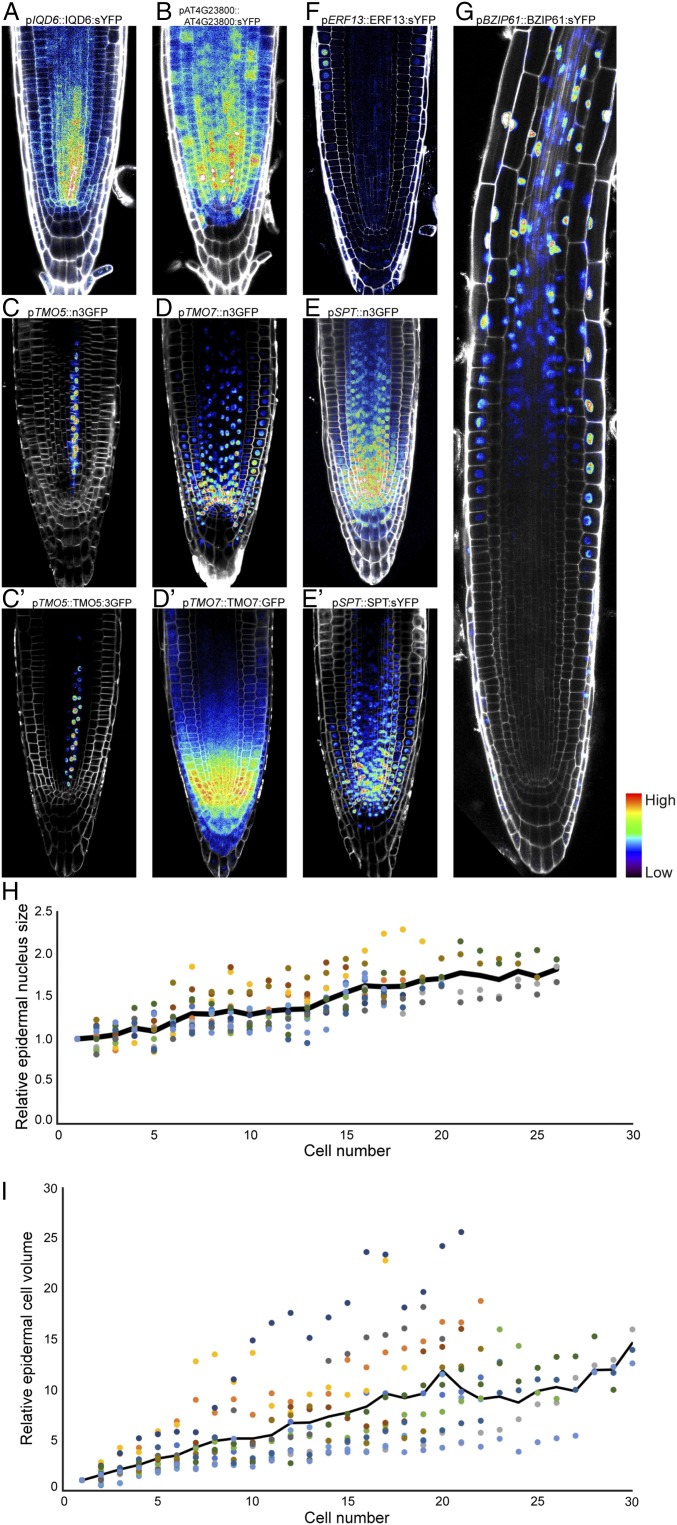
Fig. 4.
Transcriptional gradients are translated to gradients in protein abundance and correlate with cellular properties. (A–G) Translational fusions of 4: IQD6 (A), 11: AT4G23800 (B), TMO5 (C and C′), TMO7 (D and D′), SPT (E and E′), 19: ERF13 (F), and 20: BZIP61 (G) indicate similar protein gradients as observed for their transcripts (compare with Figs. 3 D and J, panels C–E, and Table 1, respectively). (H and I) Quantification of epidermal nuclear size (H) and cell volume (I) relative to cell contacting QC reveals progressive increase of both cellular parameters. Black line indicates mean relative size/volume, of 13 (nuclear size) and 18 (cell volume) cell files. Micrographs (A–G) were taken at the same magnification.

