Fig. 5.
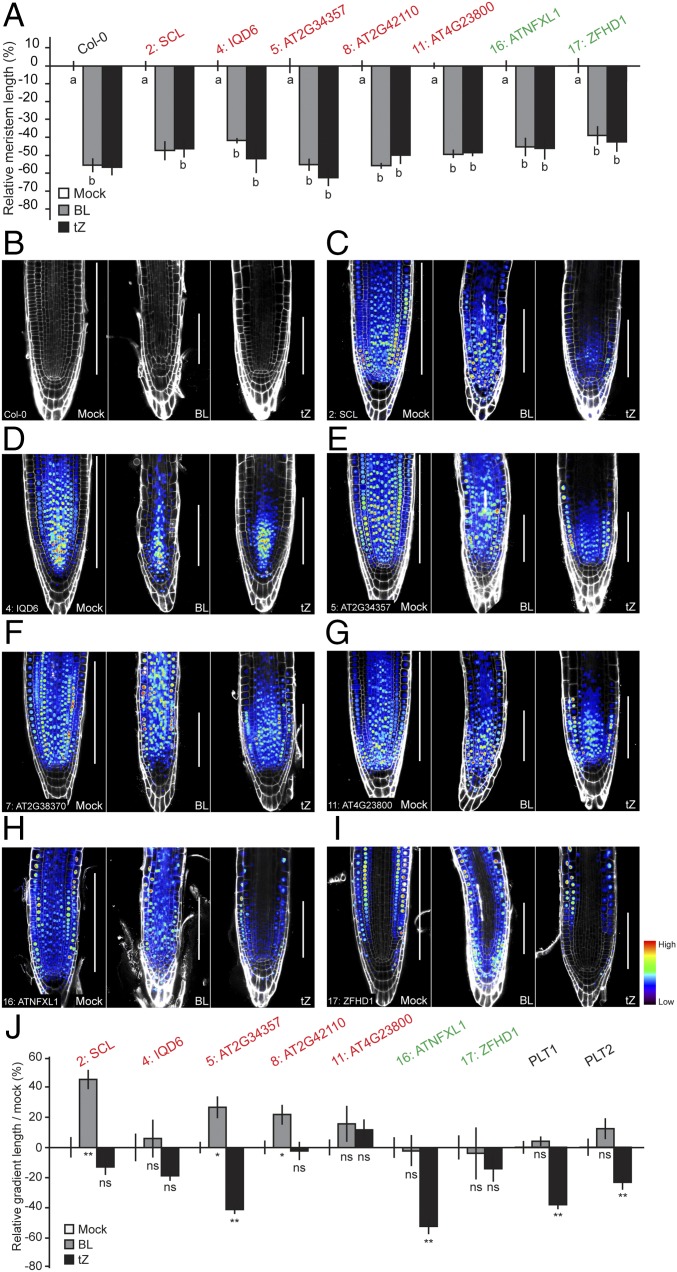
Gradient length can be uncoupled from growth. (A) Bar graph showing the relative meristem length after treatment with BL or tZ, as measured by the length from QC until the first elongating cortex cell. n = 3–10. This shows stable and easily measurable meristem length reduction after 3 d of treatment in Col-0 and reported lines. Response to hormones was found to be not significantly different between transgenic lines and Col-0 (P > 0.05; two-way ANOVA). (B–I) Confocal micrographs of Col-0 (B) and promoter lines 2: SCL (C), 4: IQD6 (D), 5: AT2G34357 (E), 7: AT2G38370 (F), 11: AT4G23800 (G), 16: ATNFXL1 (H), and 17: ZFHD1 (I) after 3 d mock treatment (Left) or with BL and tZ (Center and Right, respectively). White bars indicate meristem length. (J) Gradient length quantification of all analyzed lines after treatment. Mean relative gradient length is shown with bars indicating SE. ns, not significant; P > 0.05; *P < 0.05; **P < 0.001, as calculated by Student’s t test. Results show that gradient expression can be uncoupled from growth and PLT regulation. Genes indicated in red were idenfified in this study to show a downward gradient (P > M > D) and those in green an upward gradient (P < M < D). n = 10–19. Micrographs (B–I) were taken at the same magnification.

