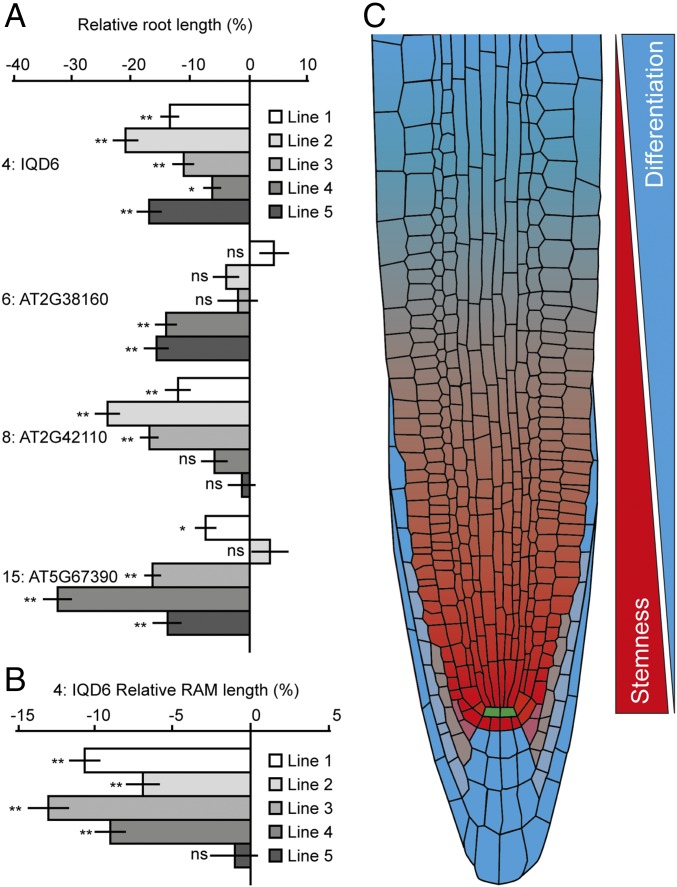
Fig. 6.
Disruption of expression gradient can lead to reduced root growth. (A) Bar graph depicting relative root length in respective overexpression lines, relative to Col-0. For each gene, multiple independent lines show a significant reduction in root length as a result of overexpression. For 4: IQD6 all independent lines had reduced root length. Mean relative root length is shown with bars indicating SE. n = 45–77. (B) Bar graph showing relative RAM length in overexpression lines of 4: IQD6, relative to Col-0. n = 56–71. RAM length reduction correlates with root length reduction and overexpression of gene 4: IQD6. Mean relative RAM length is shown with bars indicating SE. ns, not significant; P > 0.05; *P < 0.05; **P < 0.001, as calculated by Student’s t test. (C) Proposed model for proximal meristem organization by opposing gradients of stemness and differentiation potential.

