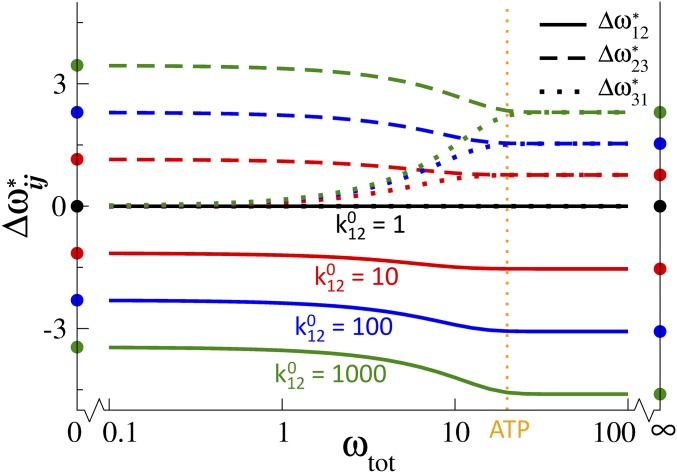
Fig. 3.
Uneven allocation of dissipation maximizes flux in a three-state FL cycle. Dissipation allocations (solid curves), (dashed), and (dotted) for the three transitions in Fig. 1B that maximize the flux. Dissipations are expressed as differences from the naive allocation of equal dissipation to each transition. is fixed, and varies with color. When (black), an even allocation of dissipation to each transition maximizes flux, and therefore, for all . As increases (black red blue green), the flux-maximizing allocation increasingly deviates from an even allocation as shown by the increasing magnitude of . Allocations at limiting are shown by circles [low plotted at (Eq. 11); high at (Eq. 13)]. The vertical dotted orange line at represents the ATP hydrolysis free energy under physiological conditions.

