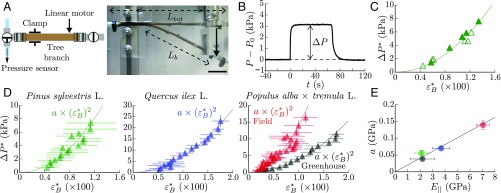
Fig. 4.
Hydraulic pulse induced by bending in natural tree branches. (A) Sketch of the experimental setup, where is the total branch length and the bent length. (Scale bar, 5 cm.) (B) Xylem water pressure measured at the fixed extremity of a pine branch (Pinus sylvestris L.) in response to a bent/unbent sequence. (C) Relationship between the overpressure and the bending strain for the same branch using two different bending protocols: incremental step displacement (filled symbols) and step displacement with return to the initial position after each bending (open symbols). Here, and , where and , with the mean curvature of the branch at rest (Extension of the Model to Beams with a Rest Curvature). The solid line is a quadratic fit of the data. (D) Overpressure vs. bending strain averaged over branches for different tree species and growing conditions (symbols) with quadratic fit (solid lines). Green: P. sylvestris L., , GPa, ; blue: Q. ilex L., , GPa, ; red: Populus alba tremula L. grown in field condition, , GPa, ; black: P. alba tremula L. grown in greenhouse conditions, , GPa, ). Each symbol corresponds to a running average over five data (seven data for poplar in field conditions) with an overlap of 50; error bars give the SD. (E) Coefficient of the quadratic fit as function of the longitudinal Young’s modulus (same color as in D). The coefficient is found proportional to (solid line: linear fit, ).

