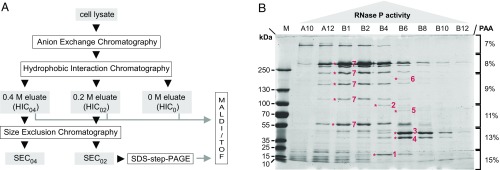
Fig. 1.
Partial purification and identification of A. aeolicus RNase P. (A) Schematic overview of the purification procedure. The applied chromatography steps and methods are shown as open boxes; the cell lysate and column fractions with RNase P activity are indicated as gray boxes. (B) SDS/PAGE analysis of “SEC0.2” fractions with RNase P activity eluting from a SEC column that had been loaded with a “HIC0.2” sample [material eluted from the hydrophobic interaction column at 0.2 M (NH4)2SO4]. Fractions with low (A10, B12), increasing (A12, B1, B2), maximum (B4), and decreasing (B6, B8, B10) RNase P activity were loaded in order of their elution from the column (SI Appendix, Fig. S5). Prominent protein bands correlating with RNase P activity were excised and identified by mass spectrometry as: 1, hypothetical protein Aq_880; 2, polynucleotide phosphorylase (PNPase); 3, uncharacterized protein homologous to RNA pseudouridine synthase from B. subtilis; 4, hypothetical protein Aq_707; 5, Aq_1754/Aq_707; 6, Aq_808/Aq_707; 7, glutamine synthetase; only two of these proteins (1 and 2) were most abundant in fraction B4, which displayed the highest RNase P activity; M, molecular mass marker.

