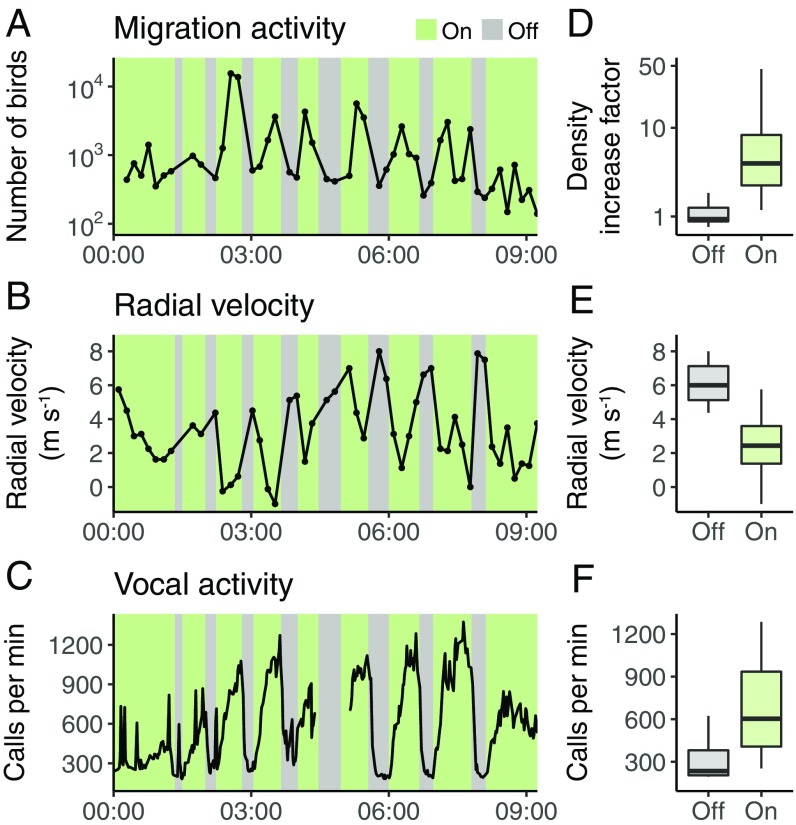
Fig. 2.
Time series of radar and acoustic measures of Tribute in Light impact on migratory birds. Observations (in Coordinated Universal Time) from September 11–12, 2015 of (A) migration activity within 500 m of the installation, (B) radial velocity within 500 m of the installation, and (C) vocal activity during periods of TiL illumination. D–F show corresponding data with and without illumination. Density increase factor (D) is defined as the peak bird density near the installation divided by the mean density 2–20 km away.

