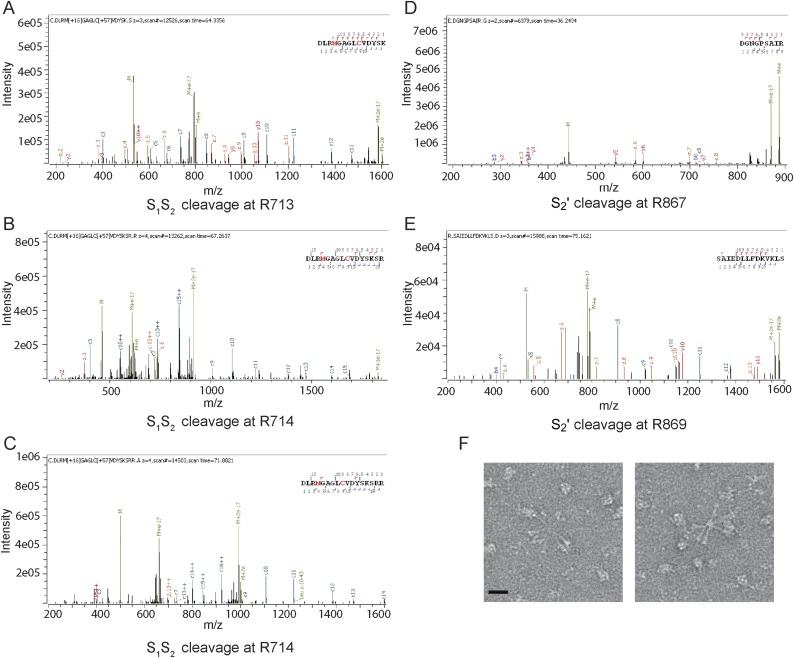
Fig. S1.
Characterization of the MHV S pre- to postfusion transition. (A–E) Annotated mass spectra showing that trypsin cleavage can occur at or near the predicted S1/S2 (A–C) and S2′ (D and E) sites. (F) Section of a micrograph with negatively stained MHV S2 rosettes formed upon incubation of prefusion S with 1:100 trypsin. (Scale bar, 10 nm.)

