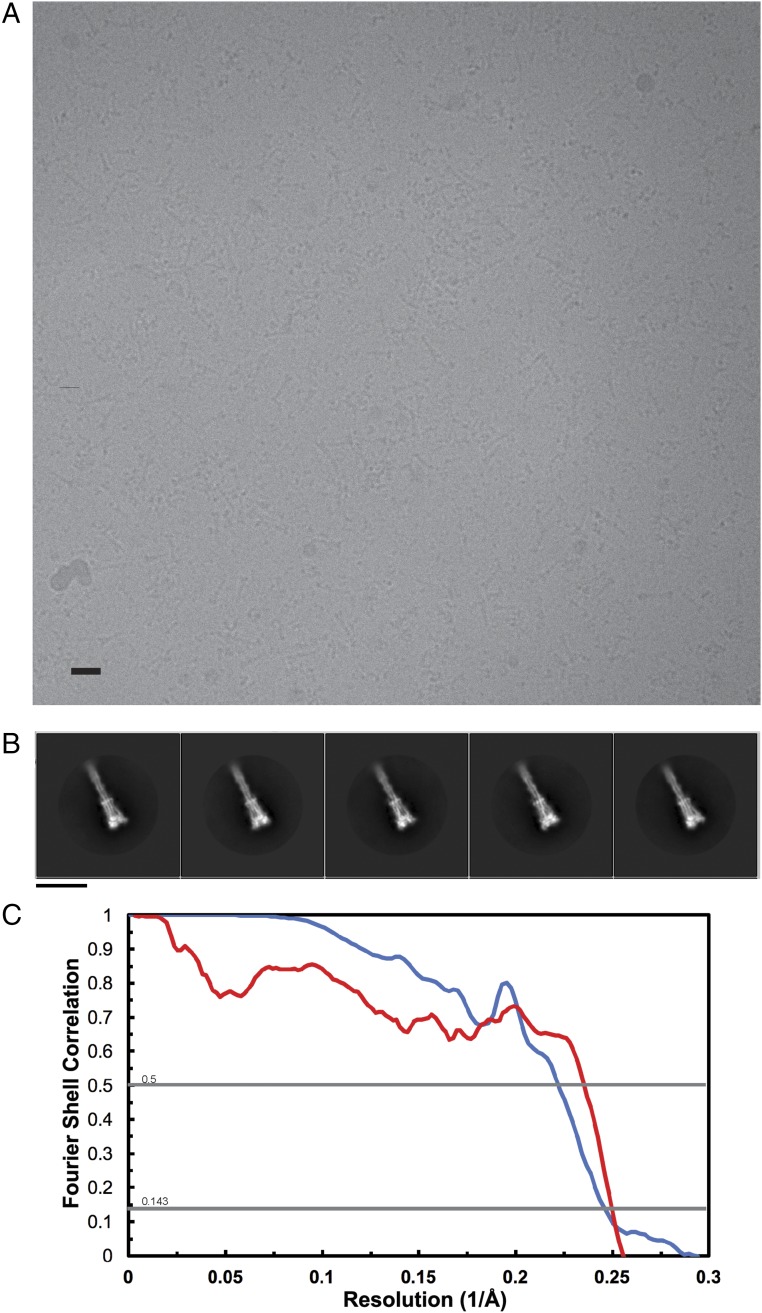
Fig. S2.
CryoEM analysis of MHV S2. (A) Representative micrograph. (Scale bar, 10 nm.) (B) 2D class averages of frozen-hydrated MHV S2 particles. (Scale bar, 10 nm.) (C) Gold-standard (blue) and model/map (red) Fourier shell correlation curves. The 0.143 and 0.5 cutoff values are indicated by horizontal gray lines. The resolution was determined to be 4.1 Å.

