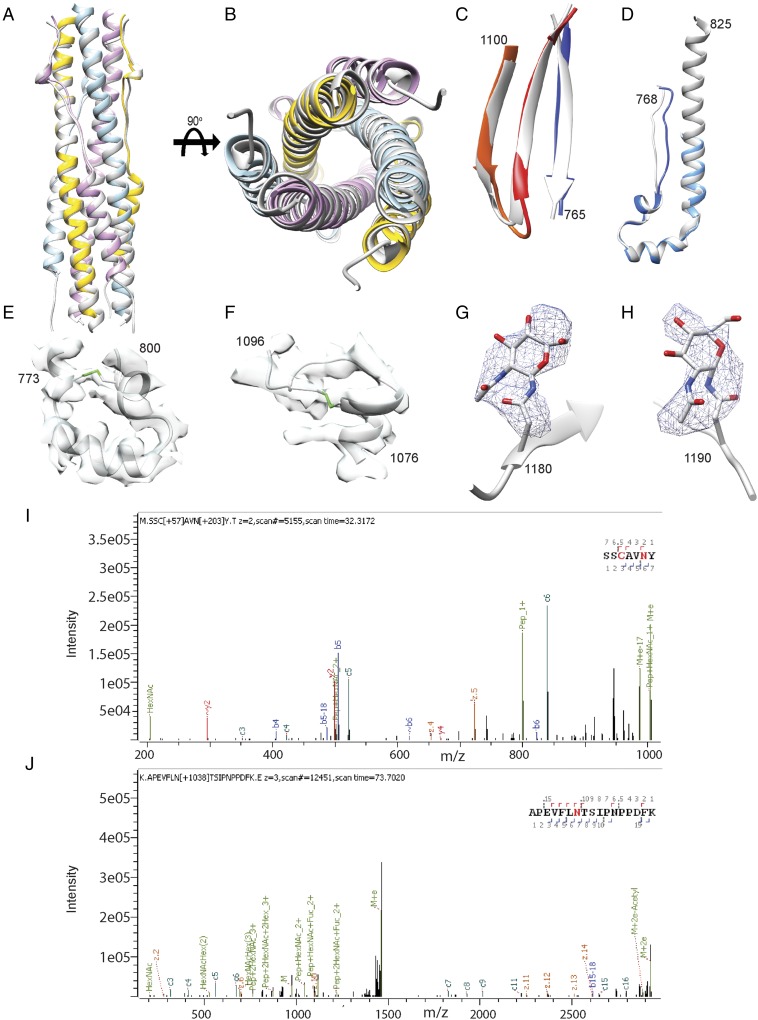
Fig. S3.
Validation of the atomic model. (A and B) Two orthogonal views of the superimposition of the HR1/HR2 six-helix bundle structure derived from the MHV S2 cryoEM map (colored by protomer) and from X-ray crystallography (Protein Data Bank ID code 1WDF, gray). (C) Comparison of the core β-sheet structure in the prefusion (gray) and postfusion (colored as in Fig. 2) MHV S spike glycoprotein. (D) Comparison of the upstream helix structure in the prefusion (gray) and postfusion (colored as in Fig. 2) MHV S spike glycoprotein. (E and F) The MHV S2 model is shown in gray ribbon with the cryoEM density shown in transparent light gray. Disulfide bonds are shown in green for residues 775–797 (E) and 1,082–1,093 (F). (G and H) Glycans linked to Asn-1180 (G) and Asn-1190 (H) are rendered as ball and sticks with the corresponding region of the cryoEM map shown as a blue mesh. Carbon, nitrogen, and oxygen atoms are colored gray, blue, and red, respectively. (I and J) Mass spectra for Asn1180 (I) and Asn1190 (J) showing the presence of glycans at these glycosylation sequons.

