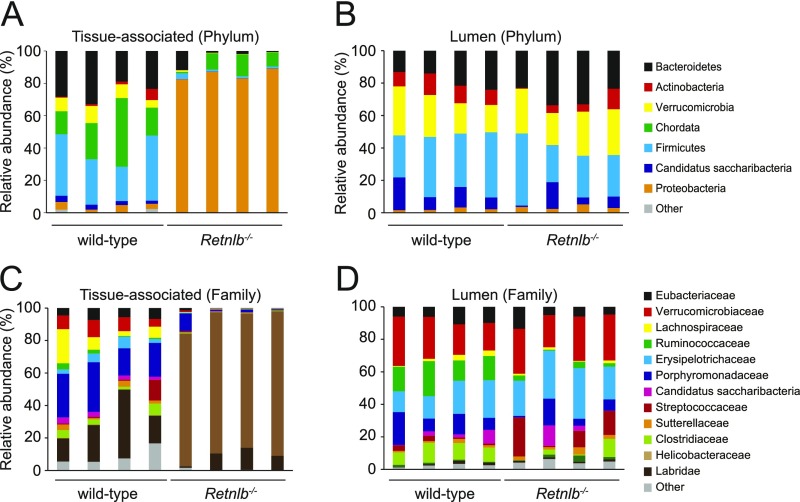
Fig. S7.
Phylogenetic analysis of 16S rRNA from tissue-associated and lumen microbial communities. Operational taxonomic units with an average of 100 reads and populations greater than or equal to 1% were included in the graphical analysis. (A and B) Phylum-level analysis of tissue-associated (A) and luminal (B) colonic bacteria. (C and D) Family-level analysis of tissue-associated (C) and luminal (D) colonic bacteria.

