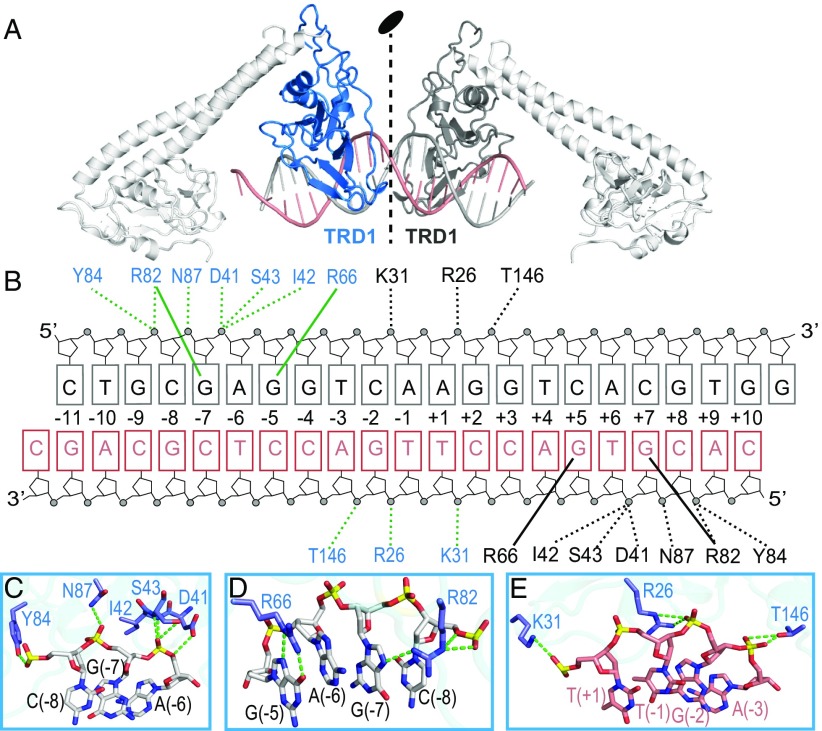
Fig. 3.
Intermolecular interactions between DNA and TRD. (A) Ribbon diagram of the DNA molecule bound to the TRD1 domains from the two S subunits in the asymmetric unit. The TRD1 domains are colored in blue and black, respectively. The two DNA strands are colored in black and salmon. (B) Schematic of the detailed interactions between TRD1s and DNA. Same color code as in A. The hydrogen bonds between protein and the sugar-phosphate backbone or the bases are shown in dashed and solid lines, respectively. (C–E) Interactions between one TRD1 domain and the bound DNA in three different regions. The hydrogen bonds are shown by green dashed lines.

