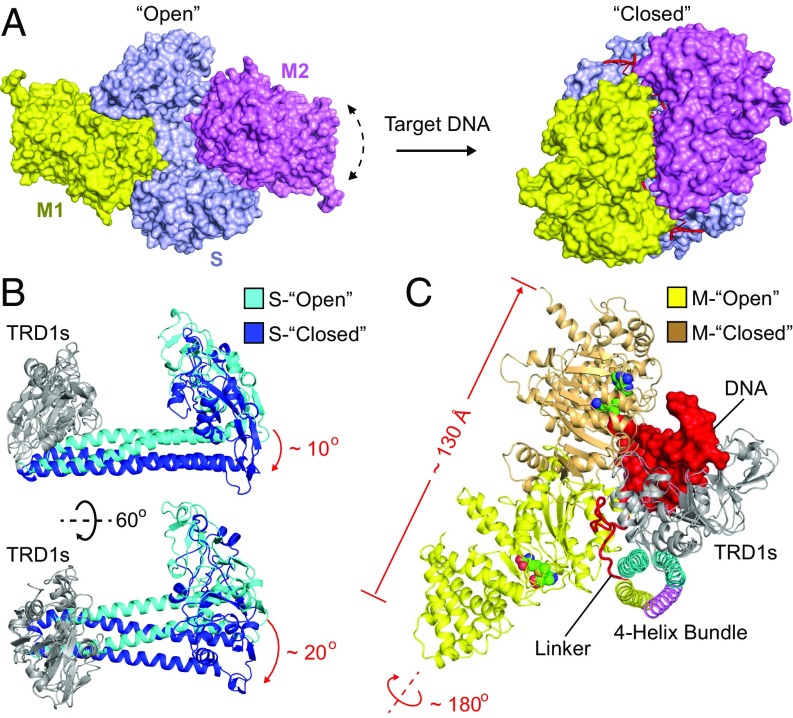
Fig. 4.
Conformational transition from open to closed. (A) Surface views of the open (Left) and closed (Right) structures of the type I MTases. The color code for proteins is the same as in Fig. 1. The DNA is shown in ribbon and red. Given the low-quality electron density, the M2 subunit of the open complex was modeled in a similar conformation to M1 by superimposing the C-helices of the two M subunits. The dashed arrow line indicates the dynamic nature of this subunit in the structure. (B) Two views of the conformational changes in the S subunit between open (cyan) and closed (blue). The TRD1 domains (gray) are superimposed as the reference point. (C) The conformational changes in the M subunit between open (yellow) and closed (brown). The DNA (red) is shown in surface presentation. The TRD1 domains are superimposed as the reference point.

