Fig. 4.
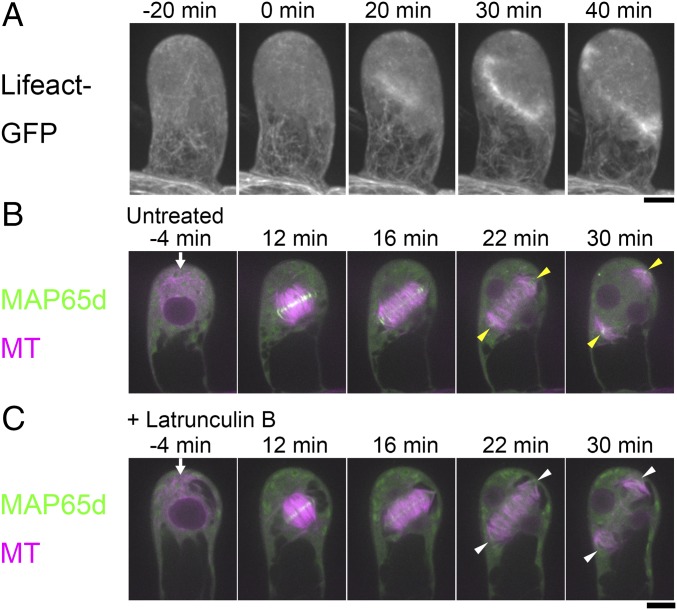
Actin inhibition has little impact on division plane determination of the gametophore initial division. (A) Localization of actin filaments during the first gametophore division visualized by the Lifeact-GFP marker. No twin peaks pattern or accumulation at the presumed gametosome location could be observed. However, strong accumulation was seen at the phragmoplast midzone. Images were acquired every 5 min with 31 z-sections (separated by 1 µm) and displayed using maximum projection. Time 0 corresponds to the timing of NEBD. (B and C) Time-lapse imaging of mCherry–α-tubulin (magenta) and Citrine-MAP65d (green) during the first division in the gametophore initial with (B) or without (C) 25 µM of the actin inhibitor Latrunculin B. Images were recorded every 2 min. Time 0 corresponds to the timing of NEBD. Arrows indicate gametosomes. Yellow arrowheads indicate MT interdigitation at the leading edge of the phragmoplast, which have prominent Citrine-MAP65d signals. White arrowheads indicate abnormal MT interdigitations at the leading edge of the phragmoplast, which lack prominent Citrine-MAP65d signals. (Scale bars, 10 µm.)

