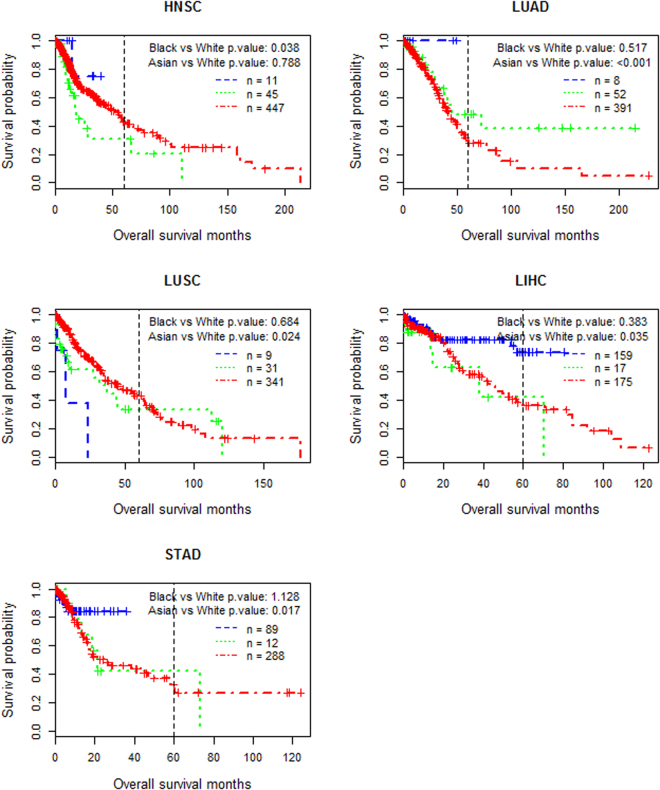
Figure 1.
Racial disparity in survival time of cancer patients. Red: White patients; Green: Black patients; Blue: Asian patients. Censored patients (samples), for whom the follow-up after treatment ends before events (death) occur, are marked with vertical ticks. For each comparison, the printed p-value is the aggregated p-value (p), which integrates p COX−PH (the p-value obtained from the Cox-PH analysis) and p RMST (the p-value obtained from the RMST method) by the conventional Bonferroni method.

