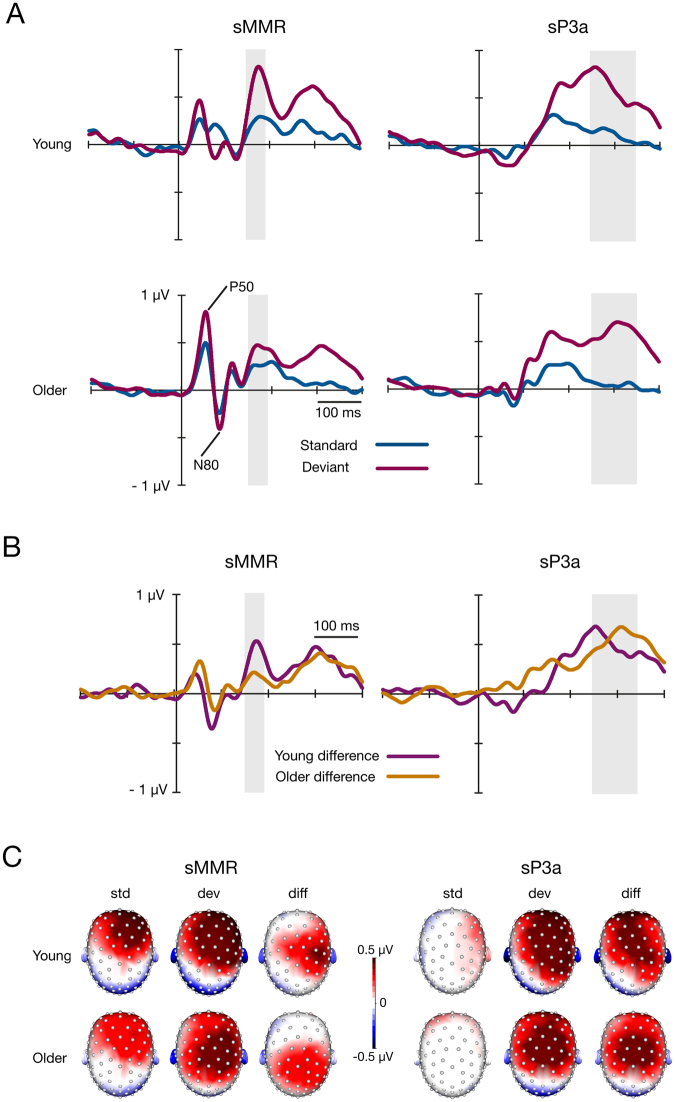
Figure 1.
(A) Grand-averaged ERPs to somatosensory standard and deviant stimuli for young and older adults and (B) the differential waveforms (standard minus deviant) for young and older adults. Waveforms represent averages of the electrode pools applied in the analyses. The grey area shows the latency range of 153–193 ms for sMMR and of 258–358 for sP3a, from where the averaged amplitude values were extracted to analyse each ERP component. (C) The scalp voltage distributions of responses to standard (std) and deviant (dev) stimuli and differential responses (diff) (deviants minus standards). The topographic maps are shown as average voltages from 153–193 ms for sMMR and from 258–358 for sP3a. Note, due to keeping the scaling equal throughout, the lateralisation of differential response in older adults is no longer observable in the scalp topography of sMMR.

