
Figure 9.
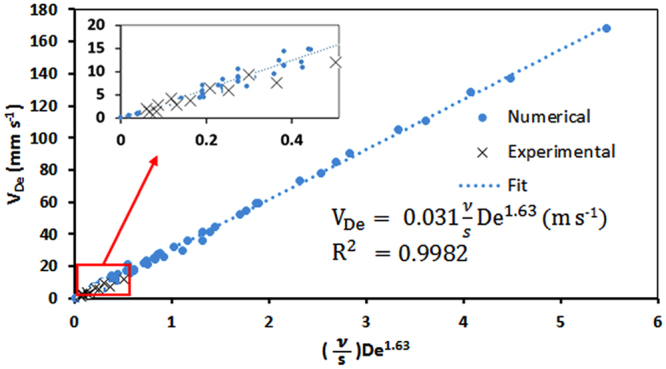
Dean velocity plotted against based on all numerical results obtained in this study. A linear function could be fitted over the data points (R2 = 0.9983) with a = 0.031 as the constant of linearity. The inset figure shows our experimental Dean velocities from single experiments in two devices with cross sectional dimensions of 100 µm × 150 µm and 300 µm × 150 µm (cross data points) that follow the numerically-determined fit very well.