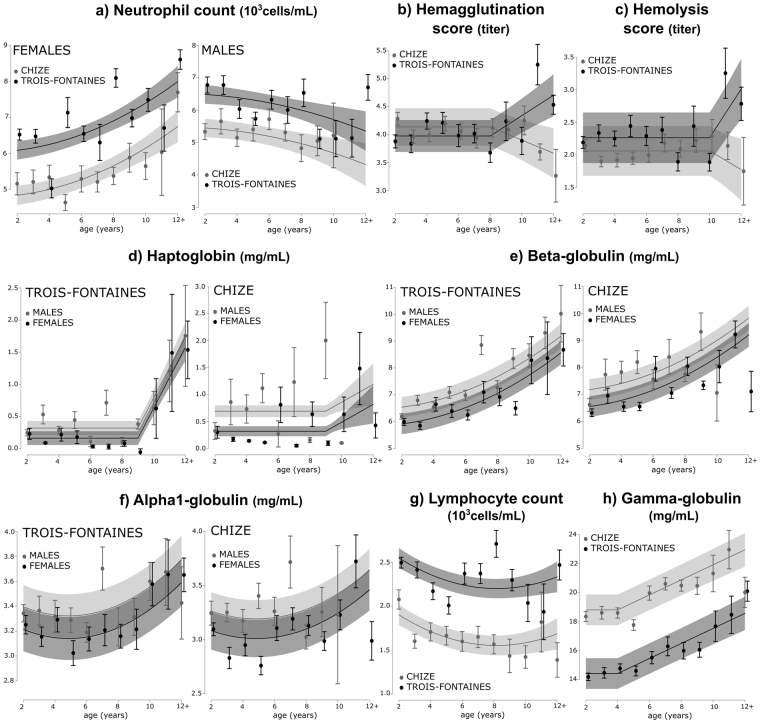
Figure 1.
Predicted age-related changes in immune parameters in two populations of roe deer (Trois-Fontaines and Chizé). Plots are based on predicted effects from the selected model for each parameter (see Table 1). The lines represent model predictions and the shaded areas the 95% CIs. The points correspond to the average value per age and the bars correspond to ± Standard Error. All individuals older than 12 years of age were pooled within a “12+” age class.

