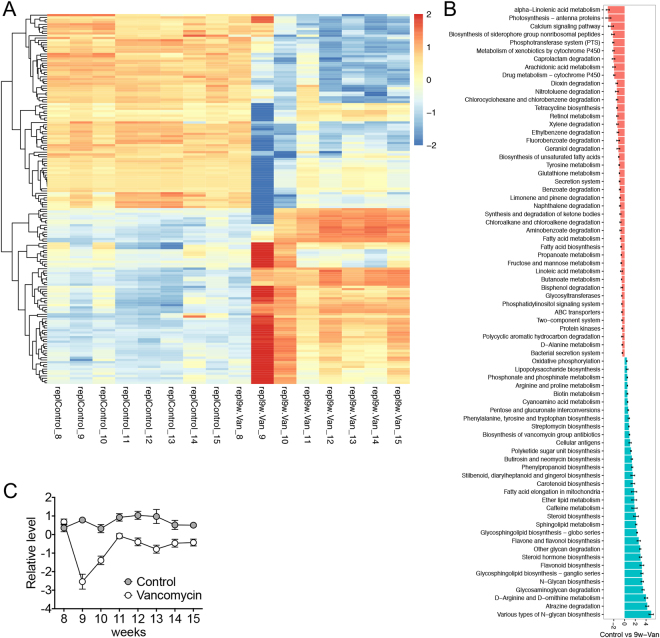
Figure 6.
Vancomycin treatment differentially affected KEGG pathways in a time-dependent manner. (A) Changes of level 3 functional pathways over time. The result of PICRUSt analysis was plotted with DESeq. 2. Raw data can be found in Table S1. Note that the 9-week microbiota samples were collected 4 days after the initiation of vancomycin treatment for the Van group. (B) Changes of level 3 functional pathways when data from 9–15 weeks were averaged within each treatment group. 9w-Van, vancomycin was given starting from 9 weeks of age. (C) Changes of the average level of 12 LPS-related functional genes over time. PICRUSt analysis was performed at the ortholog level. Raw data with the names of the LPS-related functional genes can be found in Table S2.

