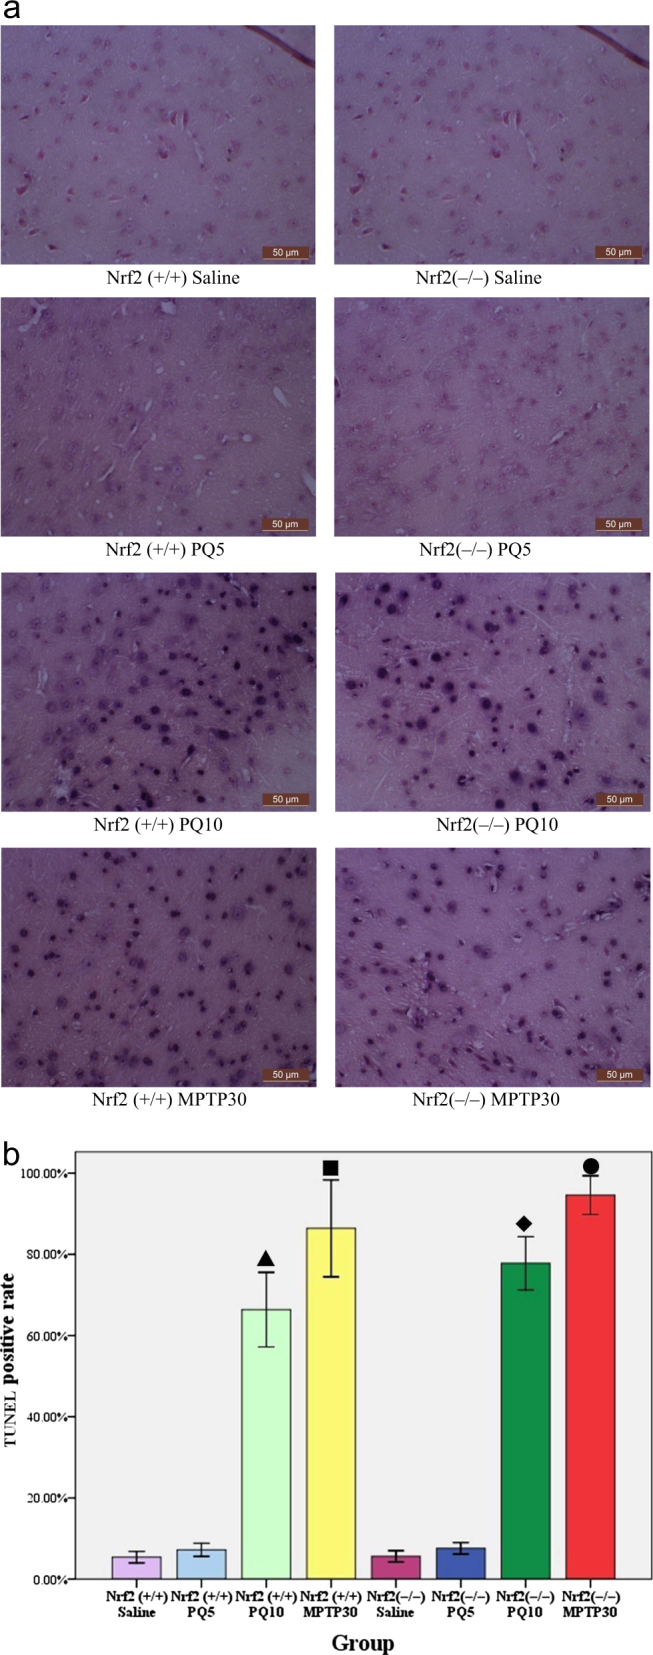
Fig. 3.

Cell apoptosis in the SN of Nrf2 (+/+) and Nrf2 (−/−) mice after treatment with PQ, MPTP or saline (n = 3). a Each microgram (400×) shows a representative view of apoptosis in the SN of each group. b TUNEL-positive rate in each group. We counted the number of TUNEL staining positive cells and the number of total cells, and calculated the TUNEL staining positive rate (the number of TUNEL positive cells/total number of cells x 100%). ▲ Nrf2 (+/+) PQ10 vs. Nrf2 (+/+) saline (p < 0.01), ■Nrf2 (+/+) MPTP30 vs. Nrf2 (+/+) saline (p < 0.01), ◆Nrf2 (−/−) PQ10 vs. Nrf2 (−/−) saline (p < 0.01), ●Nrf2 (−/−) MPTP30 vs. Nrf2 (−/−) saline (p < 0.01)
