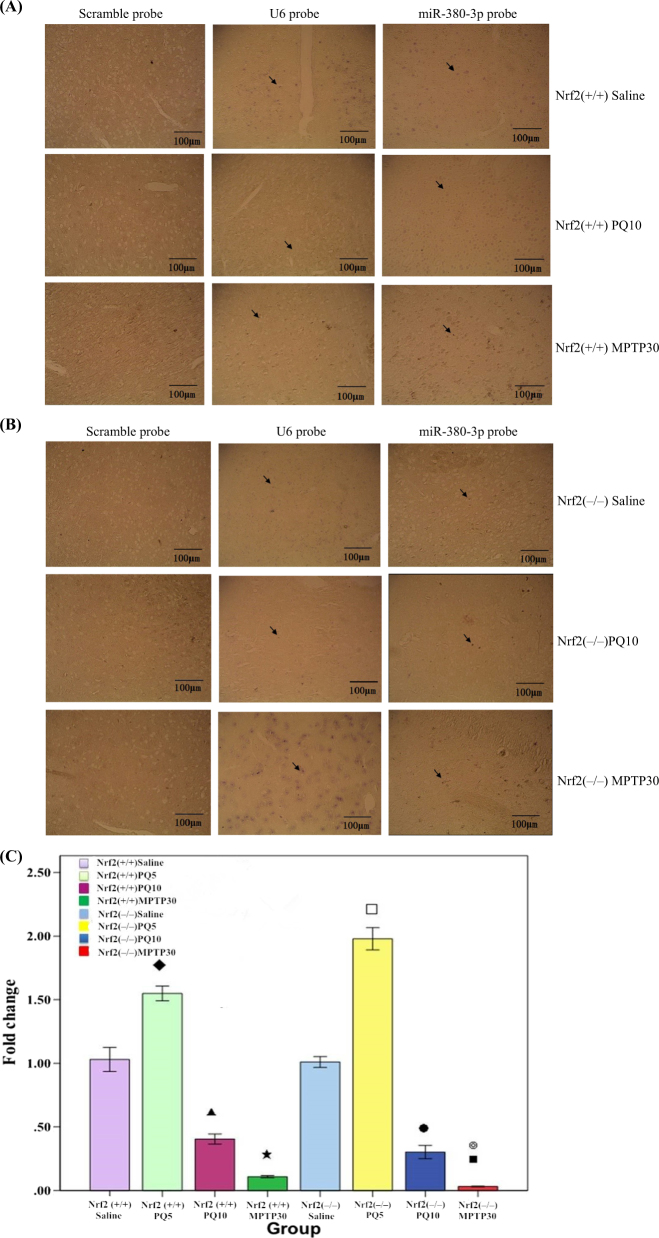
Fig. 5.
The expression level of miR-380-3p in the SN of Nrf2 (+/+) and Nrf2 (−/−)after treatment with PQ, MPTP or saline. The arrows indicated the signal of LNA™ probes for miR-380-3p. a The expression intensity of miR-380-3p analyzed by LNA–ISH hybridization in the SN of Nrf2 (+/+) ICR mice after saline, PQ or MPTP treatment (n = 3); each microgram (400×) shows a representative view of a slice of the SN from each group. b The expression intensity of miR-380-3p analyzed by LNA–ISH hybridization in Nrf2 (−/−) ICR mice SN after saline, PQ or MPTP treatment (n = 3); each microgram (400×) shows a representative view of a slice of the SN from each group. c The expression levels of miR-380-3p analyzed by real-time PCR in Nrf2 (+/+) and Nrf2 (−/−) SN after treatment with PQ, MPTP or saline (n = 4). ◆ Nrf2 (+/+) PQ5 vs. Ap (p < 0.01), ▲ Nrf2 (+/+) PQ10 vs. Nrf2 (+/+) saline (p < 0.01), ★ Nrf2 (+/+) MPTP30 vs. Nrf2 (+/+) saline (p < 0.01), □Nrf2 (−/−) PQ5 vs. Nrf2 (−/−) saline (p < 0.01), ●Nrf2 (−/−) PQ10 vs. Nrf2 (−/−) saline (p < 0.01), ■ Nrf2 (−/−) MPTP30 vs. Nrf2 (−/−) saline (p < 0.01), ◎ Nrf2 (−/−) MPTP30 vs. Nrf2 (+/+) MPTP30 (p < 0.01)

