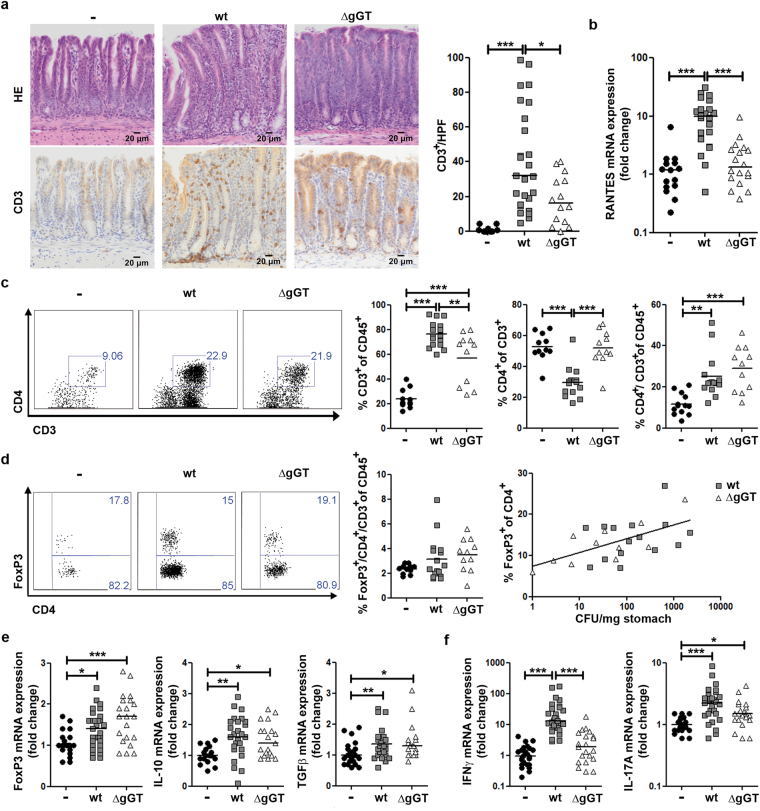
Figure 3.
T cell response in mice infected with H. pylori wt or ΔgGT. Stomachs of mice were analysed one month post infection. (a) Representative images of Haematoxylin-eosin stain (HE) and CD3 expression in the stomach mucosa of mice from four independent experiments. Number of CD3+ cells per high power field (HPF) is shown. (b) mRNA levels of RANTES determined by quantitative PCR. Data depicted are derived from four independent experiments with four to eight mice per group. (c) Flow cytometry analysis of CD4+ T cell population in the gastric mucosa of mice. An exemplary dot plot of each group is depicted. (d) FoxP3-expressing CD4+ T cells. A representative dot plot of FoxP3 expression in CD4+ T cells is displayed. Proportion of FoxP3-expressing CD4+ T cells in the CD45+ leukocyte population and a positive non-linear correlation between the FoxP3-expressing CD4+ population and bacterial burden are shown (Spearman’s r = 0,7, p = 0.0204). (e) and (f) mRNA levels of cytokines associated with a T regulatory response FoxP3, IL-10, and TGFβ and expression of effector cytokines IFNγ and IL-17 A analysed by quantitative PCR are shown. Data presented are derived from five to six independent experiments with four to eight mice per group. Kruskal-Wallis test followed by Dunn’s test for multiple comparisons. *p ≤ 0.05, **p ≤ 0.01, ***p ≤ 0.001. Horizontal lines represent medians.

