Fig. 4.
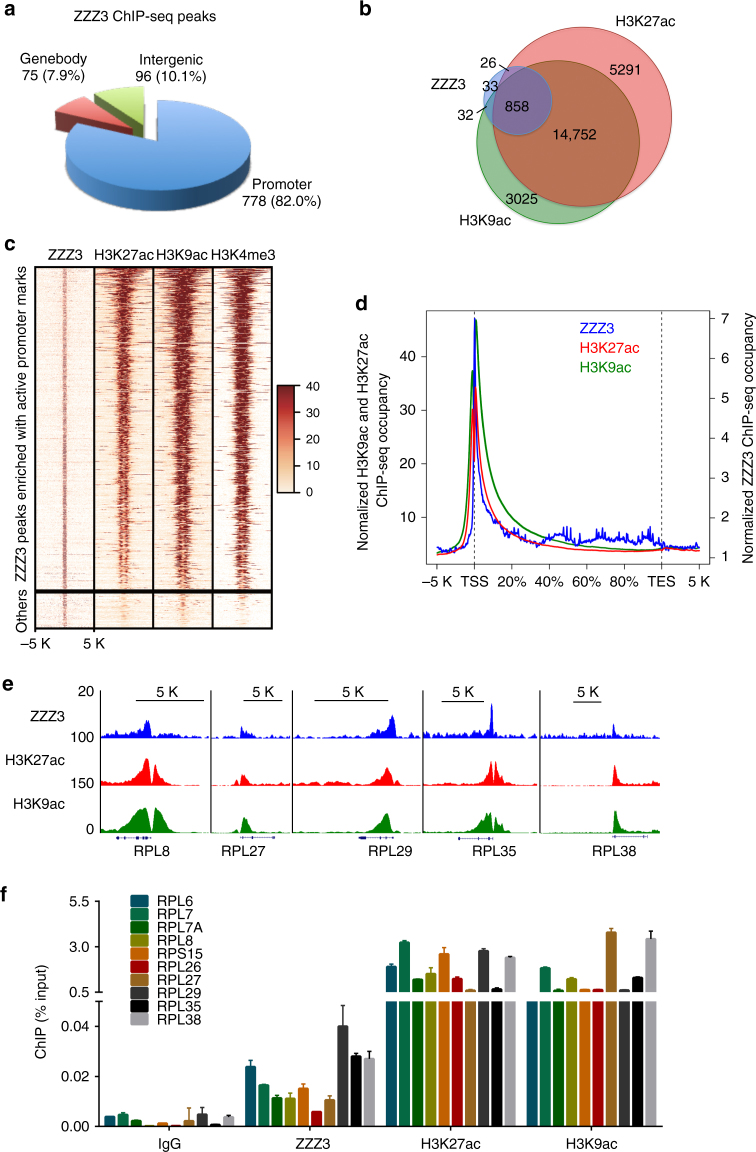
The ATAC complex co-localizes with promoter H3K27ac genome-wide. a Genomic distribution of ZZZ3 ChIP-seq peaks in H1299 cells. The peaks are enriched in the promoter regions (transcription start site ±3kb). p < 2.2 × 10⁻¹⁶ (binomial test). b Venn diagram showing the overlap of ZZZ3 (blue), H3K27ac (red) and H3K9ac (green) occupied peaks. p < 1.79 × 10−63 (Super exact test). c Heatmaps of normalized density of ZZZ3, H3K27ac, H3K9ac and H3K4me3 ChIP-seq tags centered on ZZZ3-binding peaks in a ±5 kb window. The color key represents the signal density, where darker red represents higher ChIP-Seq signal. d Average genome-wide occupancies of ZZZ3 (blue), H3K27ac (red) and H3K9ac (green) along the transcription unit. The gene body length is normalized by percentage from the TSS to transcription termination site (TES). 5 kb regions upstream of TSS and 5 kb regions downstream of TES are also included. e Genome-browser view of the ZZZ3-ChIP-seq (blue), H3K27ac-ChIP-seq (red), and H3K9acChIP-seq (green) peaks on the indicated ribosomal protein genes. f qPCR analysis of ZZZ3, H3K27ac and H3K9ac ChIP in the promoters of representative ribosomal protein genes. IgG was used as a negative control. Error bars indicate S.E.M. of three biological repeats

