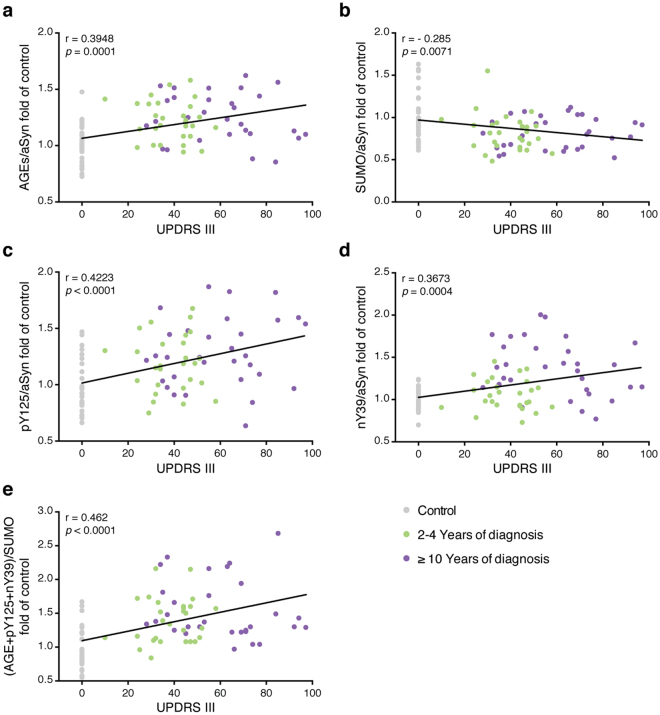
Figure 5.
The levels of the PTMs correlate with MDS-UPDRS III. The correlation between the levels of glycation (a), SUMOylation (b), pY125 (c), nY39 (d) or of their combination (e) and UPDRS III scores was evaluated using linear regression analysis with Pearson’s correlation. The level of each individual PTM and corresponding UPDRS III score of healthy individuals (Control, grey), and patients between 2-4 years (green) or with ≥10 years (purple) is presented.

