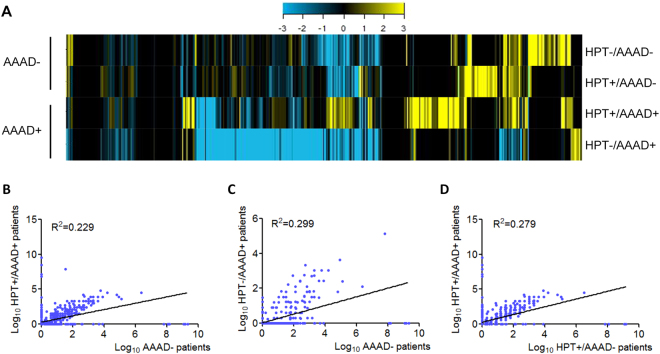
Figure 2.
MiRNA profiles in AAAD+ and AAAD− groups detected by TLDA. (A) Heat map showing the relative expression of miRNAs that changed in the serum of AAAD− patients (HPT−/AAAD− and HPT+/AAAD−) and AAAD+ individuals (HPT+/AAAD+ and HPT−/AAAD+). Each sample comprised a pool of serum samples of indicated group. Each column depicts an individual miRNA. The fold change for the samples is colour-coded according to the key. (B–D) Pearson’s correlation scatter plot of plasm miRNA levels between AAAD+ and AAAD− groups; (B) between HPT+/AAAD+ patients and AAAD− groups; (C) between HPT−/AAAD+ patients and AAAD− groups; (D) between HPT+/AAAD+ patients and HPT+/AAAD− individuals. HPT: hypertension; AAAD: acute Stanford A aortic dissection.

