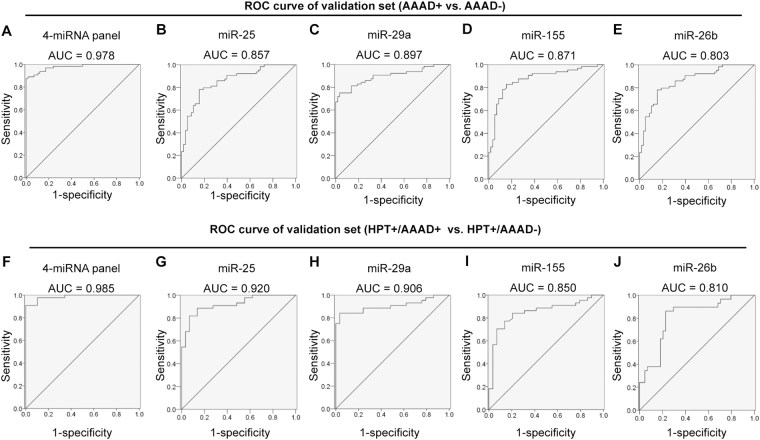
Figure 4.
ROC curve analysis for discrimination between AAAD+ patients and AAAD− control serum samples and between HPT+/AAAD+ patients and HPT+/AAAD− control samples based on the three-serum profile. (A–E) ROC curve for the ability of miR-panel (A), miR-25 (B), miR-29a (C), miR-155 (D) and miR-26b (E) to separate AAAD+ patients from AAAD− individuals the in validation set; (F–J) ROC curve for the ability of miR-panel (F), miR-25 (G), miR-29a (H), miR-155 (I) and miR-26b (J) to separate HPT+/AAAD+ patients from HPT+/AAAD− individuals the in validation set. HPT: hypertension; AAAD: acute Stanford A aortic dissection.

