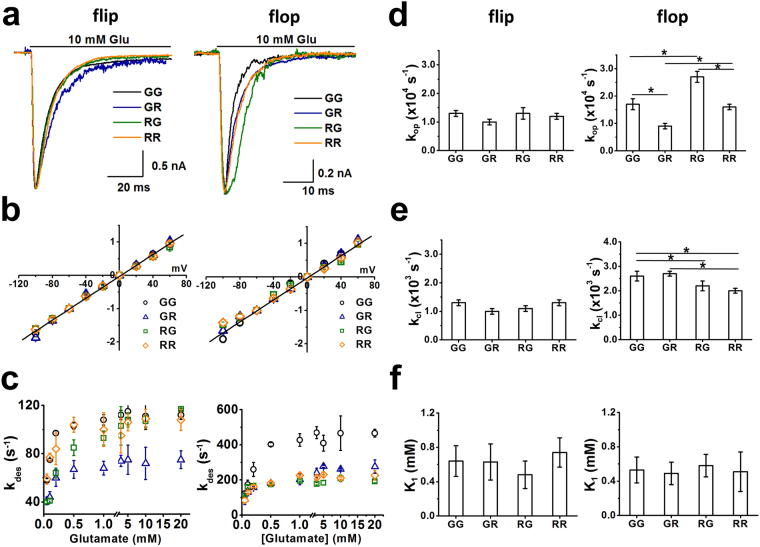
Figure 3.
Kinetic properties of GluA2Q/2R complex channels with different R/G editing status. (a) Representative whole-cell current traces (10 mM glutamate) from GluA2Qflip/2Rflip (left) and GluA2Qflop2Rflop (right) channels with four different R/G editing combinations, labeled in different colors and letters. For example, GR refers to the channel that contains the R/G edited in the GluA2Q and R/G unedited in the GluA2R isoforms (these are the same labels in Table 2). (b) Current-voltage relationships for GluA2Qflip/2Rflip and GluA2Qflop/2Rflop with different R/G editing status. Peak current amplitudes were measured from HEK-293 cells voltage clamped from −100 mV to +60 mV), and were normalized to current amplitudes at −60 mV. (c) Dependence of desensitization rate (kdes) on glutamate concentration for via GluA2Qflip/2Rflip (left) and GluA2Qflop/2Rflop (right) channels. (d) The kop values of GluA2Qflip/2Rflip (left) and GluA2Qflop/2Rflop (right) channels, full pairwise comparisons were performed for flip and flop, respectively. (One-way ANOVA with Tukey’s correction; flip: p = 0.77, F3,5 = 3.96; flop(RR) versus flop(RG), p ≤ 0.05, n = 3; flop(RR) versus flop(GR), p ≤ 0.05, n = 3; flop(RR) versus flop(GG), p = 0.98, n = 3; flop(RG) versus flop(GR), p ≤ 0.05, n = 3; flop(GG) versus flop(RG), p ≤ 0.05, n = 3; flop(GG) versus flop(GR), p ≤ 0.05, n = 3). (e) The kcl values of GluA2Qflip/2Rflip (left) and GluA2Qflop/2Rflop (right) channels, full pairwise comparisons were performed for flip and flop, respectively. (One-way ANOVA with Tukey’s correction; flip: p = 0.73, F3,5 = 4.33; flop(RR) versus flop(RG), p = 0.60, n = 3; flop(RR) versus flop(GR), p ≤ 0.05, n = 3; flop(GG) versus flop(RG), p ≤ 0.05, n = 3; flop(GG) versus flop(GR), p = 0.35, n = 3;flop(GG) versus flop(RR), p ≤ 0.05, n = 3; flop(GR) versus flop(RG), p ≤ 0.05, n = 3). (f) K1 values of GluA2Qflip/2Rflip (left) and GluA2Qflop/2Rflop (right) channels. All the K1 values are determined from non-linear fitting of the dose-response data to equation, fittings are shown in Supplementary Fig. S1b,c. (3) (One-way ANOVA with Tukey’s correction; flip, p = 0.60, F3,5 = 4.47; flop, p = 1.01, F3,5 = 4.88). The detailed linear fittings in both (d) and (e) are provided in Supplementary Figs. S2 and S3. All of the constants are summarized in Table 2. *p ≤ 0.05.

