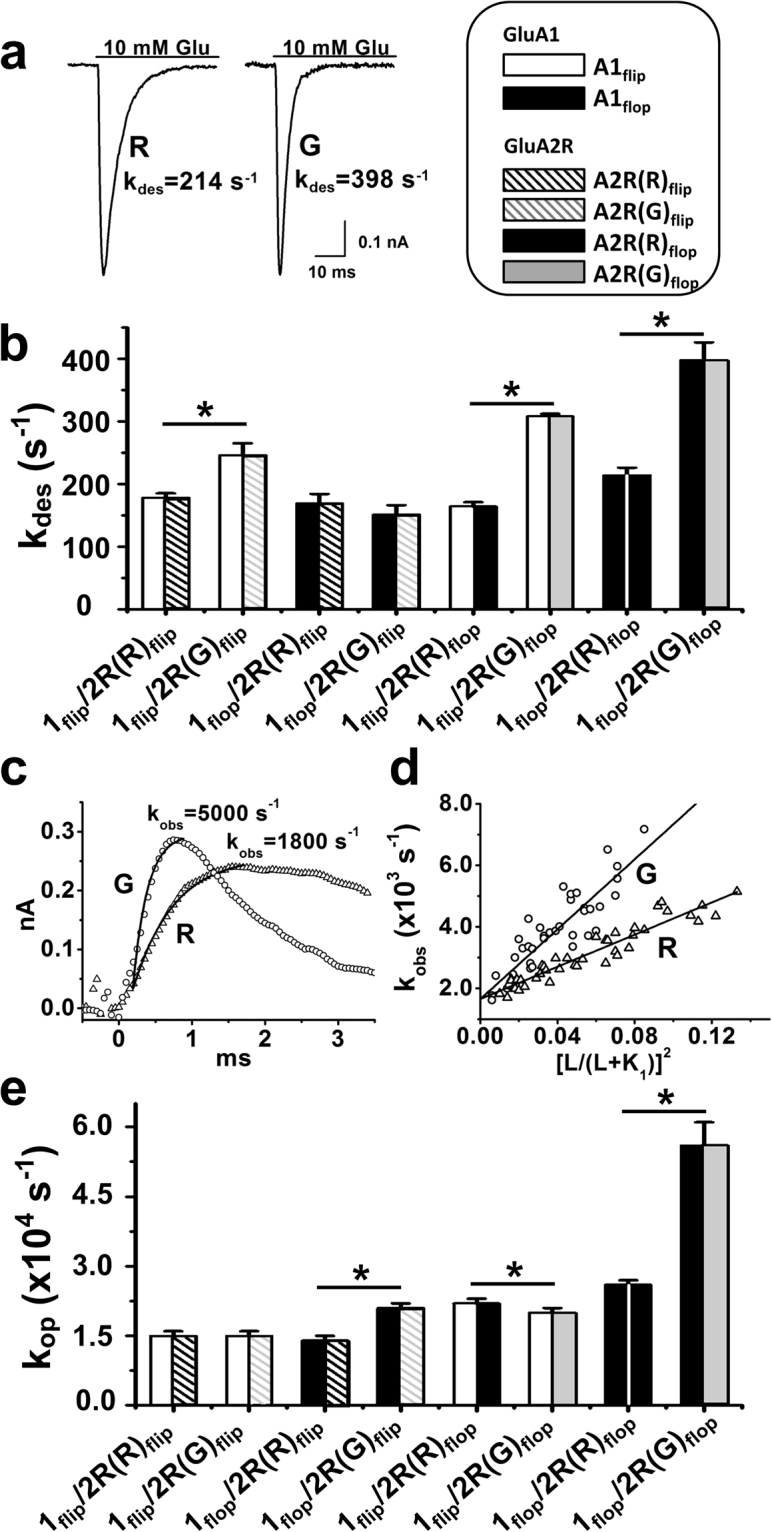
Figure 4.

Effect of the R/G editing in GluA2R on the kinetic properties of GluA1/2R heteromeric channels. (a) Representative whole-cell current responses of GluA1flop/2R(R)flop (left) and GluA1flop/2R(G)flop (right) channels to 10 mM glutamate. (b) Maximum kdes values (at saturated glutamate concentrations) of GluA1/2R with different flip/flop and R/G editing (in GluA2R) status. From left to right, GluA2R in the flip form is shown in columns 1–4 and the flop form is in columns 5–8. All the columns are also shown in specific patterns, and the bar codes are shown in the box on top of panel (b). One-way ANOVA with Tukey’s correction was done for columns 1–4 or group 1(flip group) and columns 5–8 or group 2 (flop group), respectively (n = 3). Each group was subjected to full pairwise comparisons; yet, for clarity, only those pairs that were statistically significant between R and G are labeled in the figure (Group 1: columns 1 and 2, p ≤ 0.05; columns 1 and 3, p = 0.75; columns 1 and 4, p = 0.54; columns 2 and 3, p ≤ 0.05; columns 2 and 4, p ≤ 0.05; columns 3 and 4, p = 0.36. Group 2: columns 5 and 6, p ≤ 0.05; columns 5 and 7, p ≤ 0.05; columns 5 and 8, p ≤ 0.05; columns 6 and 7, p ≤ 0.05; columns 6 and 8, p ≤ 0.05; columns 7 and 8, p ≤ 0.05). (c) A pair of representative whole-cell current traces from the opening of GluA1flop/2R(R)flop and GluA1flop/2R(G)flop channels initiated by a laser-pulse photolysis of caged glutamate at time zero. The observed channel opening rate constant, kobs, was determined by fitting the rising phase to a single-exponential rate expression (equation (1)), shown as the solid line. (d) Linear fit of kobs as a function of glutamate concentration (by equation (2)) of GluA1flop/2R(R)flop (R, Δ) and GluA1flop/2R(G)flop channels (G, ○), respectively. The kop and kcl values are shown in Tables 3 and 4. (e) The kop values of various GluA1/2R channels with different R/G editing and flip/flop status. From left to right, GluA2R in the flip form is shown in columns 1–4 while the flop form is in columns 5–8. One-way ANOVA with Tukey’s correction was done for columns 1–4 or group 1(flip group) and columns 5–8 or group 2 (flop group), respectively (n = 3). Each group was subjected to full pairwise comparisons; yet, for clarity, only those pairs that were statistically significant between R and G are labeled in the figure (Group 1: columns 1 and 2, p = 0.88; columns 1 and 3, p = 0.85; columns 1 and 4, p ≤ 0.05; columns 2 and 3, p = 0.78; columns 2 and 4, p ≤ 0.05; columns 3 and 4, p ≤ 0.05. Group 2: columns 5 and 6, p = 0.11; columns 5 and 7, p ≤ 0.05; columns 5 and 8, p ≤ 0.05; columns 6 and 7, p ≤ 0.05; columns 6 and 8, p ≤ 0.05; columns 7 and 8, p ≤ 0.05). The detailed linear fittings in (e) are provided in Supplementary Fig. S6. All the constants are summarized in Tables 3 and 4. *p ≤ 0.05.
