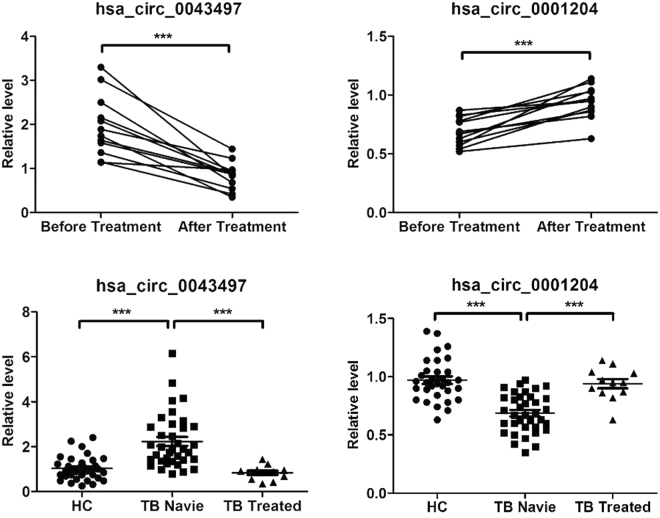
Figure 5.
Change in the levels of hsa_circ_0043497 and hsa_circ_0001204 in response to therapy. The levels of hsa_circ_0043497 and hsa_circ_0001204 were measured by RT-qPCR. Dot plot shows relative levels of hsa_circ_0043497 and hsa_circ_0001204 in the same patients before and after completion of therapy (n = 12). Relative levels of hsa_circ_0043497 and hsa_circ_0001204 in healthy controls (n = 32), pulmonary TB naive patients (n = 36) and TB treated group (n = 12). The value between the healthy control and TB treated group is not significantly different. ***P < 0.001.

