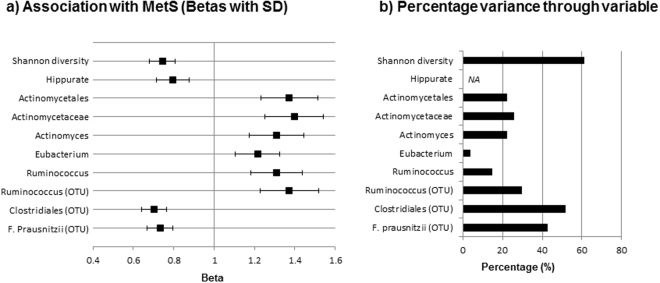
Figure 2.
Associations between diversity, the hippurate trend, diet and OTUs and collapsed taxa with MetS status. (a) Shows the associations between MetS with Shannon diversity, the hippurate trend, and OTUs/taxa (significantly associated with hippurate, the diet score and MetS) represented as betas with SEs; all variables have been standardized. The diet score was not significantly associated with MetS. (b) Shows the percentage variance in the metabolite trend and MetS that was accounted for by the MetS association with Shannon diversity or associated OTUs/taxa. Abbreviations: MetS, metabolic syndrome; OTU, operational taxonomic unit; NA, not applicable.

