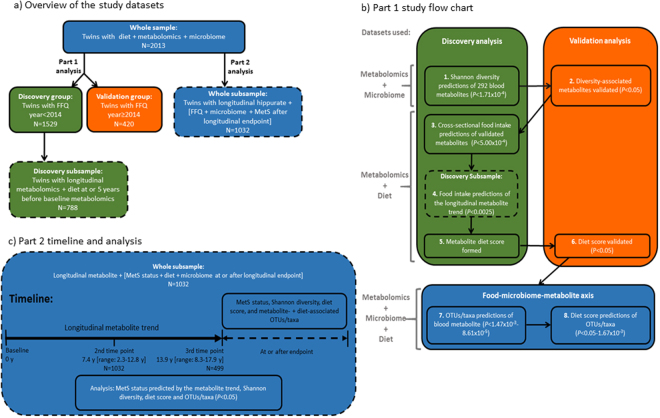
Figure 3.
Overview of the study datasets and flow chart of study design. (a) Provides an overview of the study datasets. There were 5 different datasets used in the study. The colors and outline of the boxes indicate the datasets used; color: blue, whole; green, discovery; orange, validation; outline: solid, whole; dashed, subsample. All individuals included in the study had FFQ, blood metabolomics and microbiome data available. For part 1 cross-sectional analyses the whole sample was divided into discovery and validation groups based on when FFQs were completed. A subsample of individuals from the discovery group were used to examine baseline diet associations with longitudinal blood metabolomics. For part 2 analysis a subsample of individuals from the whole dataset were used to examine MetS associations with longitudinal metabolomics and cross-sectional diet and microbiome. (b) Shows the study outline for part 1 of the analysis where metabolite markers of microbiome diversity were identified and their relationship to diet examined. The flow chart is numbered in the order the analysis was conducted. On the left side of the figure the datasets used for each analysis step are indicated. (c) Shows the study outline for part 2 analysis where longitudinal levels of the top metabolite marker were examined for its relationship with MetS. Shannon diversity, the diet score, and metabolite- and diet-associated OTUs/taxa were investigated for their association with MetS status cross-sectionally.Abbreviations: MetS, metabolic syndrome; NA, not applicable.

