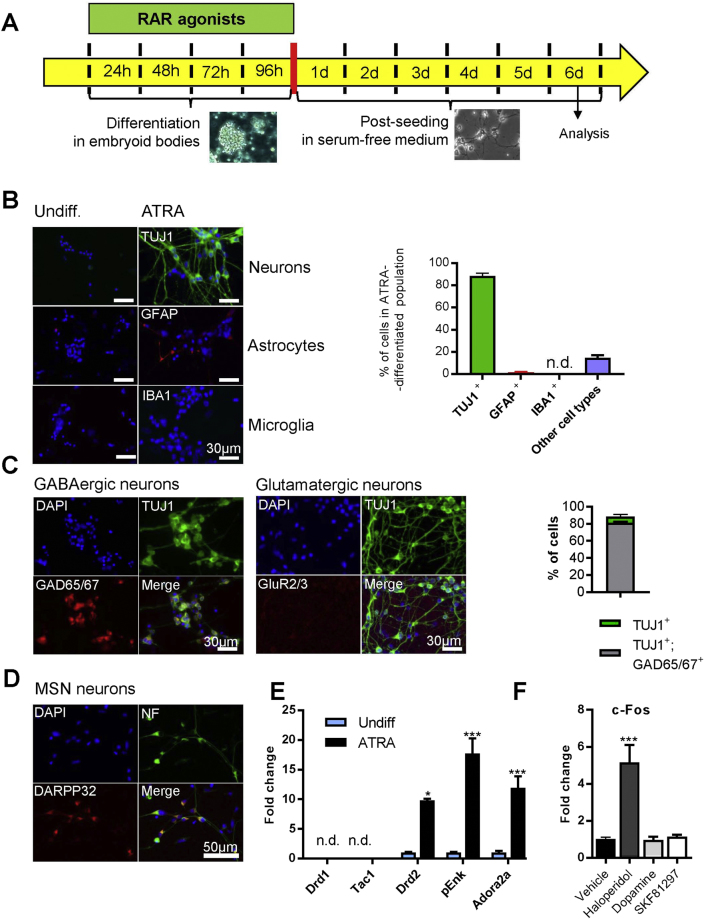
Figure 1.
Cellular populations after ATRA-mediated differentiation of EC cells. (A) Experimental design of embryoid body differentiation, retinoid treatments, and sample collection. (B) Neurons, astrocytes and microglial cells were assessed in ATRA-differentiated EC cells by immunofluorescent detection of TUJ1, GFAP and IBA1, respectively (see left panels for an example, and histograms for quantification). (C) Immunofluorescence analyses of excitatory glutamatergic (GluR2/3+) and inhibitory (GAD65/67+) neurons. (D) Immunofluorescent detection of DARPP32+ medium-spiny neurons (MSNs) within neuronal (Neurofilament, NF+) cells. (E) mRNA expression levels of striatonigral and striatopallidal MSN markers quantified by qPCR. Expression is plotted as fold change as compare to expression level in undifferentiated cells. *p < 0.05; **p < 0.01; ***p < 0.001 as compare to undifferentiated cells. (F) Induction of c-Fos expression measured by RT-qPCR, 90 min after haloperidol (10 µM), dopamine (1 µM) or SKF81297 (1 µM) treatment. Expression is plotted as a fold change with respect to control cells treated with vehicle. ***p < 0.001 as compared to vehicle treatment. Throughout the figure, graph bars represent mean ± s.e.m. for 3 independent experiments for immunocytochemistry and 5 independent experiments for qPCR. n.d., not detected.

