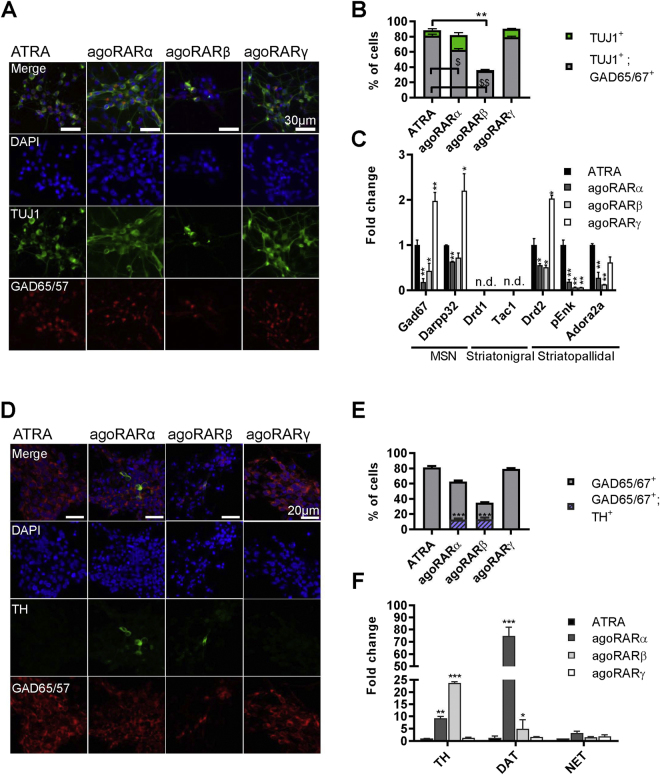
Figure 2.
Differentiation of EC embryoid bodies by distinct RAR agonists. (A) Examples of immunofluorescent detection of neuronal (TUJ1+) and GABAergic (GAD65/67+) markers in cell populations obtained after treatments with different RAR agonists. (B) Quantification of GABAergic (TUJ1+; GAD65/67+) and non-GABAergic neurons (TUJ1+) (n = 4 experiments per treatment). **p < 0.01 as compare to TUJ+ cells obtained in ATRA treatment; $p < 0.05, $$p < 0.01 as compare to number of GAD65/67+ neurons obtained after ATRA differentiation (C) mRNA expression levels of striatonigral and striatopallidal MSN markers quantified by qPCR for each treatment group (n = 5 experiments). The expression of each marker is plotted as fold change with respect to ATRA treatment. *p < 0.05; **p < 0.01 as compared to expression level in ATRA group. (D) Example of immunofluorescent detection of GABAergic (GAD65/67) and dopaminergic (TH) markers in cell populations obtained after treatment with selective RAR agonists. (E) Quantification of GAD65/67+ and GAD65/67+; TH+ neurons (n = 4 experiments) ***p <0.001 as compared to ATRA group. (F) mRNA expression of markers specific for dopaminergic and noradrenergic neurons (n = 5 experiments). The expression of each marker is plotted as fold change with respect to ATRA treatment. ***p < 0.001,**p < 0.01, *p < 0.05 as compared to ATRA group. n.d., not detected.

