Figure 1.

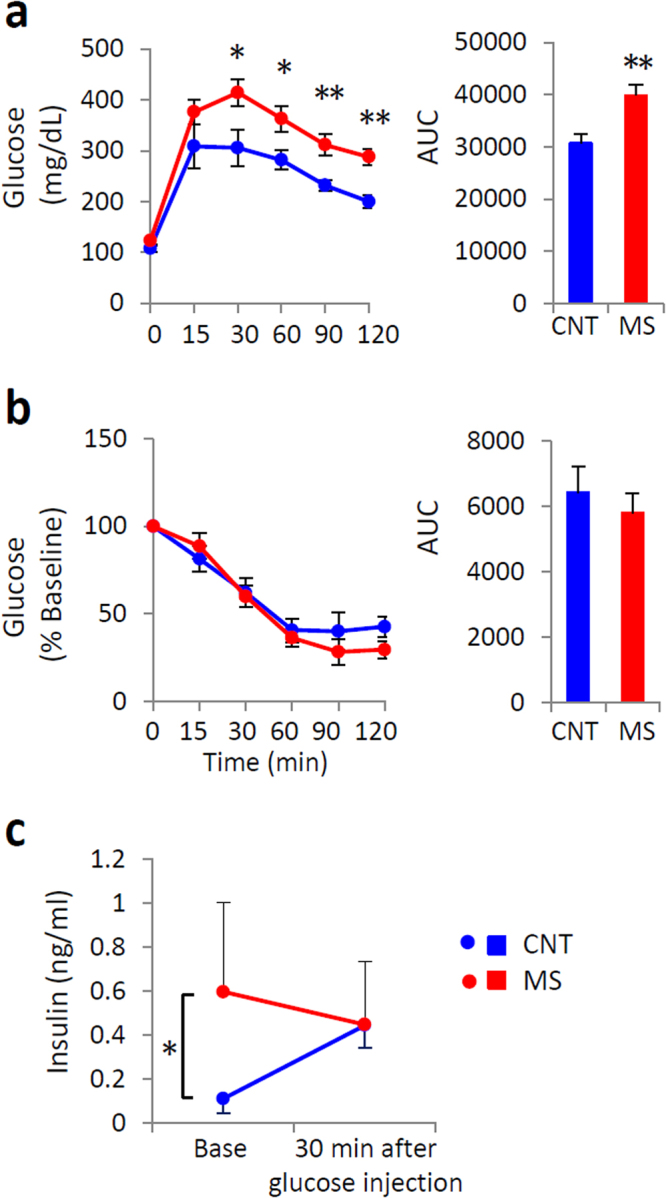
Chronic mild stress (MS) impaired glucose tolerance. An intraperitoneal glucose tolerance test (GTT) (a) and an insulin tolerance test (ITT) (b) were performed in control (CNT) and MS mice via rearing on a wire net for 3 weeks. The area under the blood glucose curve (AUC) from GTT and ITT measurements is shown in the right panels. Plasma insulin levels in response to an intraperitoneal glucose injection after 3 weeks of MS (c). Blue circles and bars indicate CNT mice, and red circles and bars indicate MS mice. All data are expressed as the means ± SEM (a,b: n = 8–11/group, c: n = 5/group). *p < 0.05, **p < 0.01, CNT versus MS mice.
