Fig. 5.
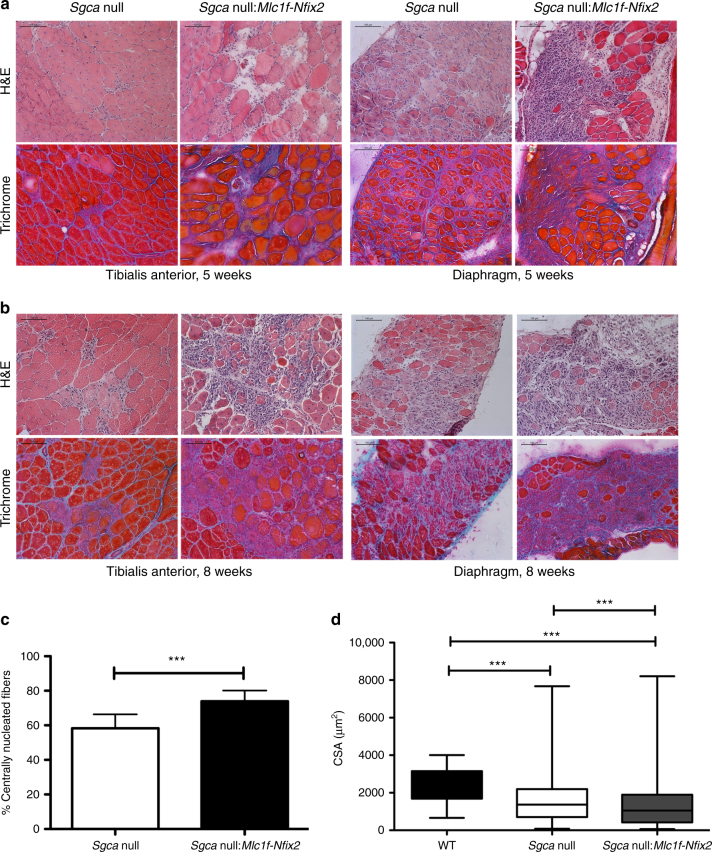
Nfix overexpression in skeletal muscle exacerbates the dystrophic phenotype. a Hematoxylin and eosin (H&E) and Milligan’s trichrome staining of tibialis anterior (left) and diaphragm (right) muscles at 5 weeks of age; N = 4 Sgca null and 9 Sgca null:Mlc1f-Nfix2 mice. Scale bar 100 μm. b Hematoxylin and eosin (H&E) and Milligan’s trichrome staining of tibialis anterior (left) and diaphragm (right) muscles at 8 weeks of age; N = 6 Sgca null and 30 Sgca null:Mlc1f-Nfix2 mice. Scale bar 100 μm. c Percentage of centrally nucleated myofibers in tibialis anterior muscles at 8 weeks of age; N = 11 Sgca null and 18 Sgca null:Mlc1f-Nfix2 mice. Mean ± SD; t test, ***P < 0.001. d Myofiber cross-sectional area distribution at 8 weeks of age; N = 186 fibers for WT, 908 for Sgca null, and 1026 for Sgca null:Mlc1f-Nfix2 mice. Mean ± whiskers from min to max; one-way ANOVA with Bonferroni post-test, ***P < 0.001. See also Supplementary Fig. 4 for PCR and WB analysis of Nfix expression in Sgca null:Mlc1f-Nfix2 mice, as well as for central nucleation and CSA measurements

